Reports Section #
In this section, all reports from different modules of the system are accessible in one place.
The Reports section includes 5 main categories:
📊 Leads Reports #
A powerful tool for evaluating sales team performance, reviewing lead sources, and analyzing customer conversion trends. Fully visual and easy to understand, it gives a clear view from lead acquisition to final sale.
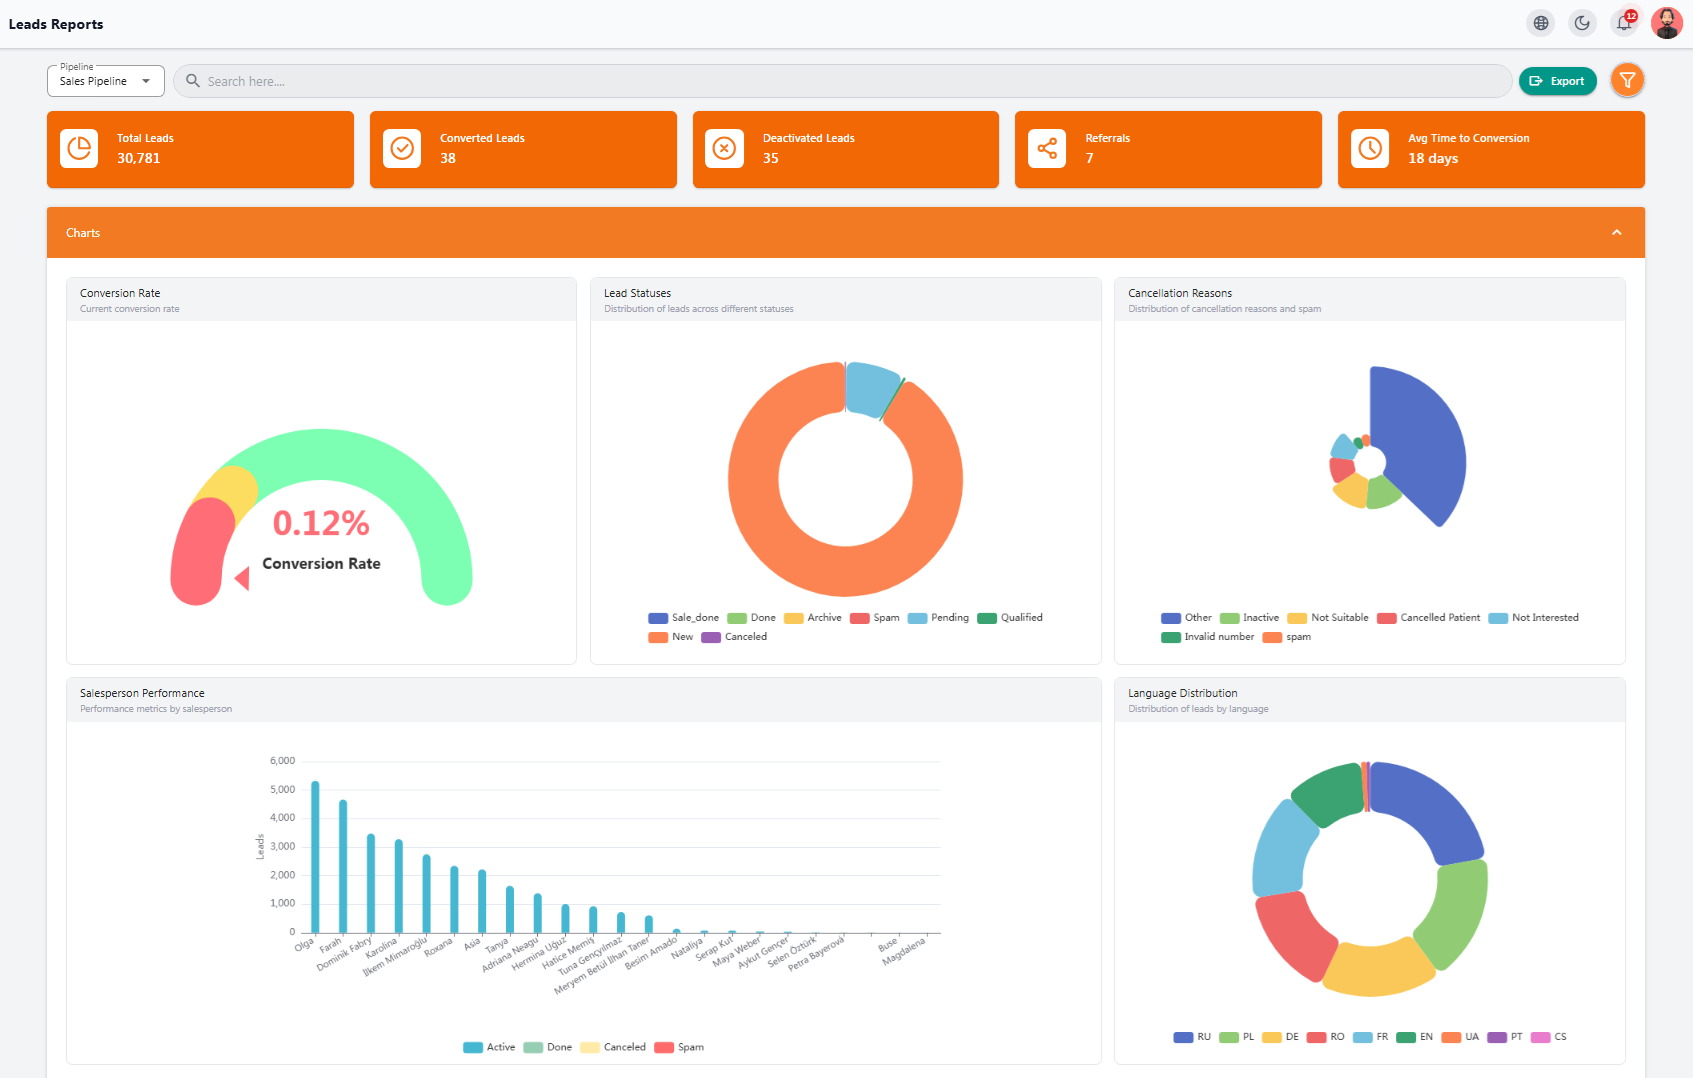
Key Metrics #
• Total Leads – Total registered leads
• Converted Leads – Leads that resulted in a final sale
• Deactivated Leads – Inactive or canceled leads
• Referrals – Referred leads
• Avg Time to Conversion – Average time taken to convert a lead into a customer
Analytical Charts #
• Conversion Rate – Percentage of successful lead conversions
• Lead Statuses – Current status distribution of all leads
• Cancellation Reasons – Detailed analysis of lost leads
• Salesperson Performance – Comparison of sales team productivity
• Language Distribution – Lead language breakdown to define target markets
Sales Funnel – Shows lead progression from entry to final sale, segmented by language
Lead Sources – Displays acquisition channels such as WhatsApp, Facebook, Website, Google, etc.
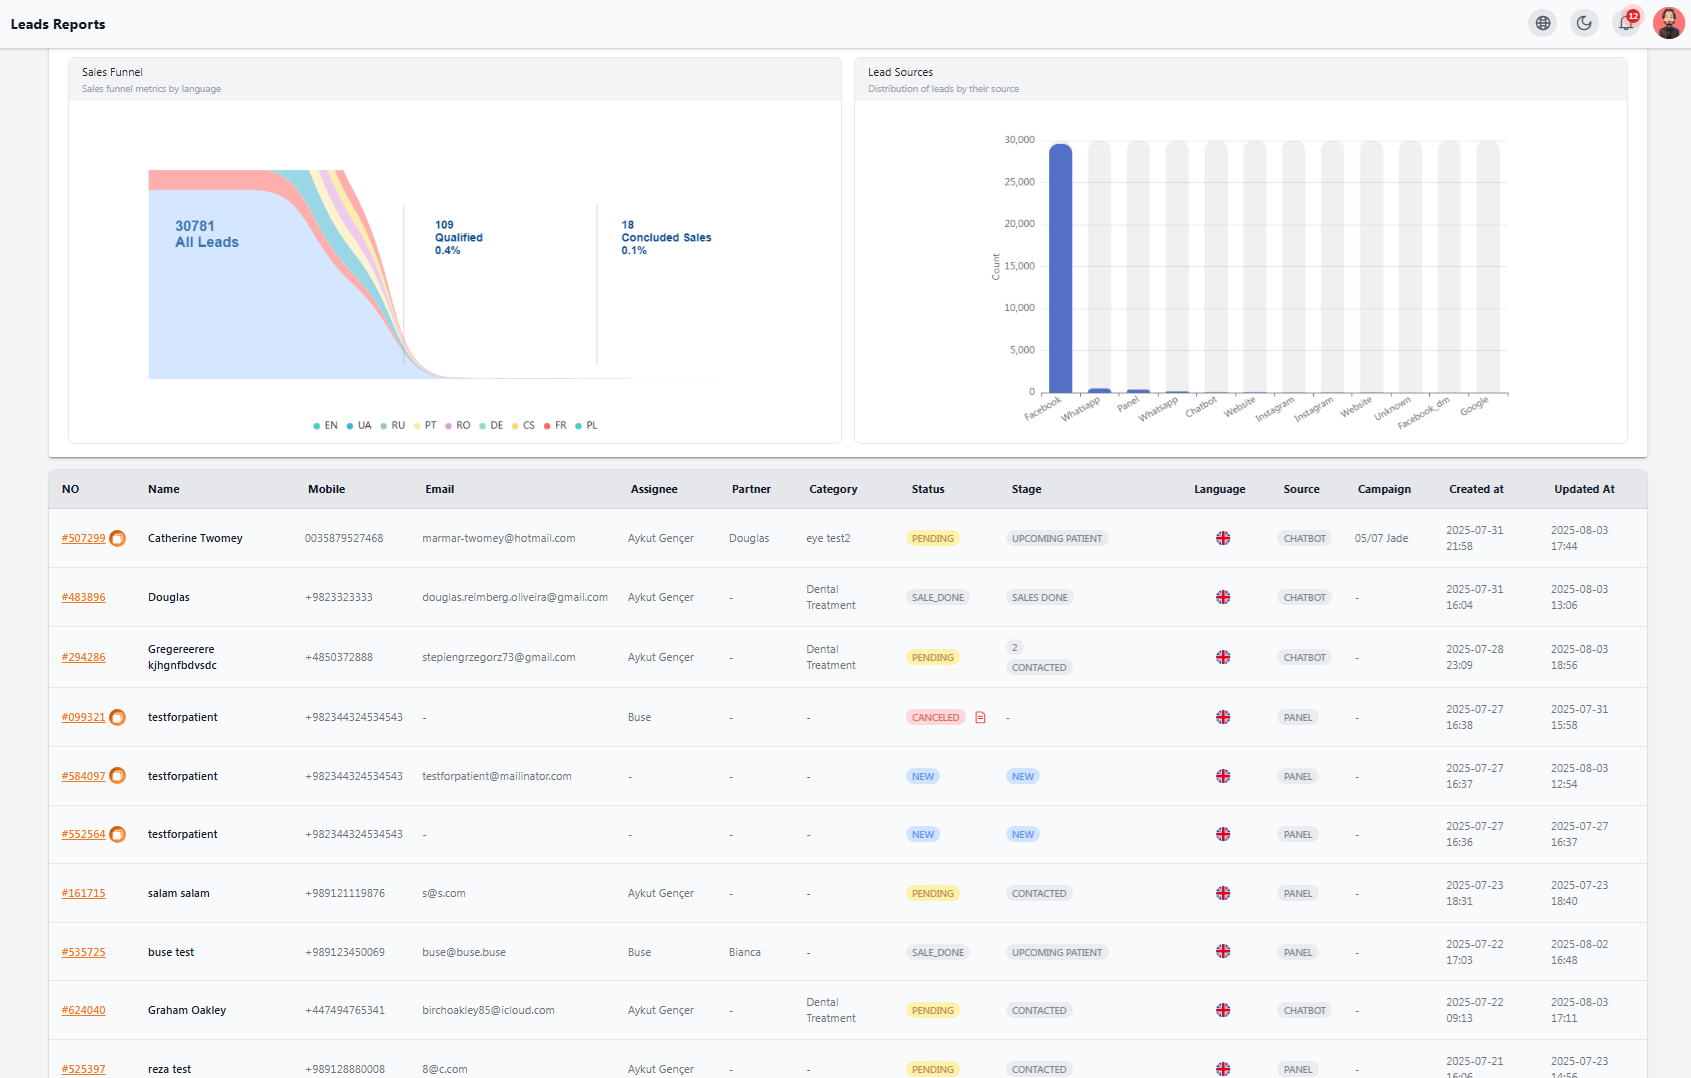
Leads Table #
Full list with
• Name, phone, email
• Salesperson, category, status, stage
• Language, source, campaign, creation & update dates
📋 Tasks Reports #
A smart and practical tool for tracking, managing, and monitoring all registered tasks.
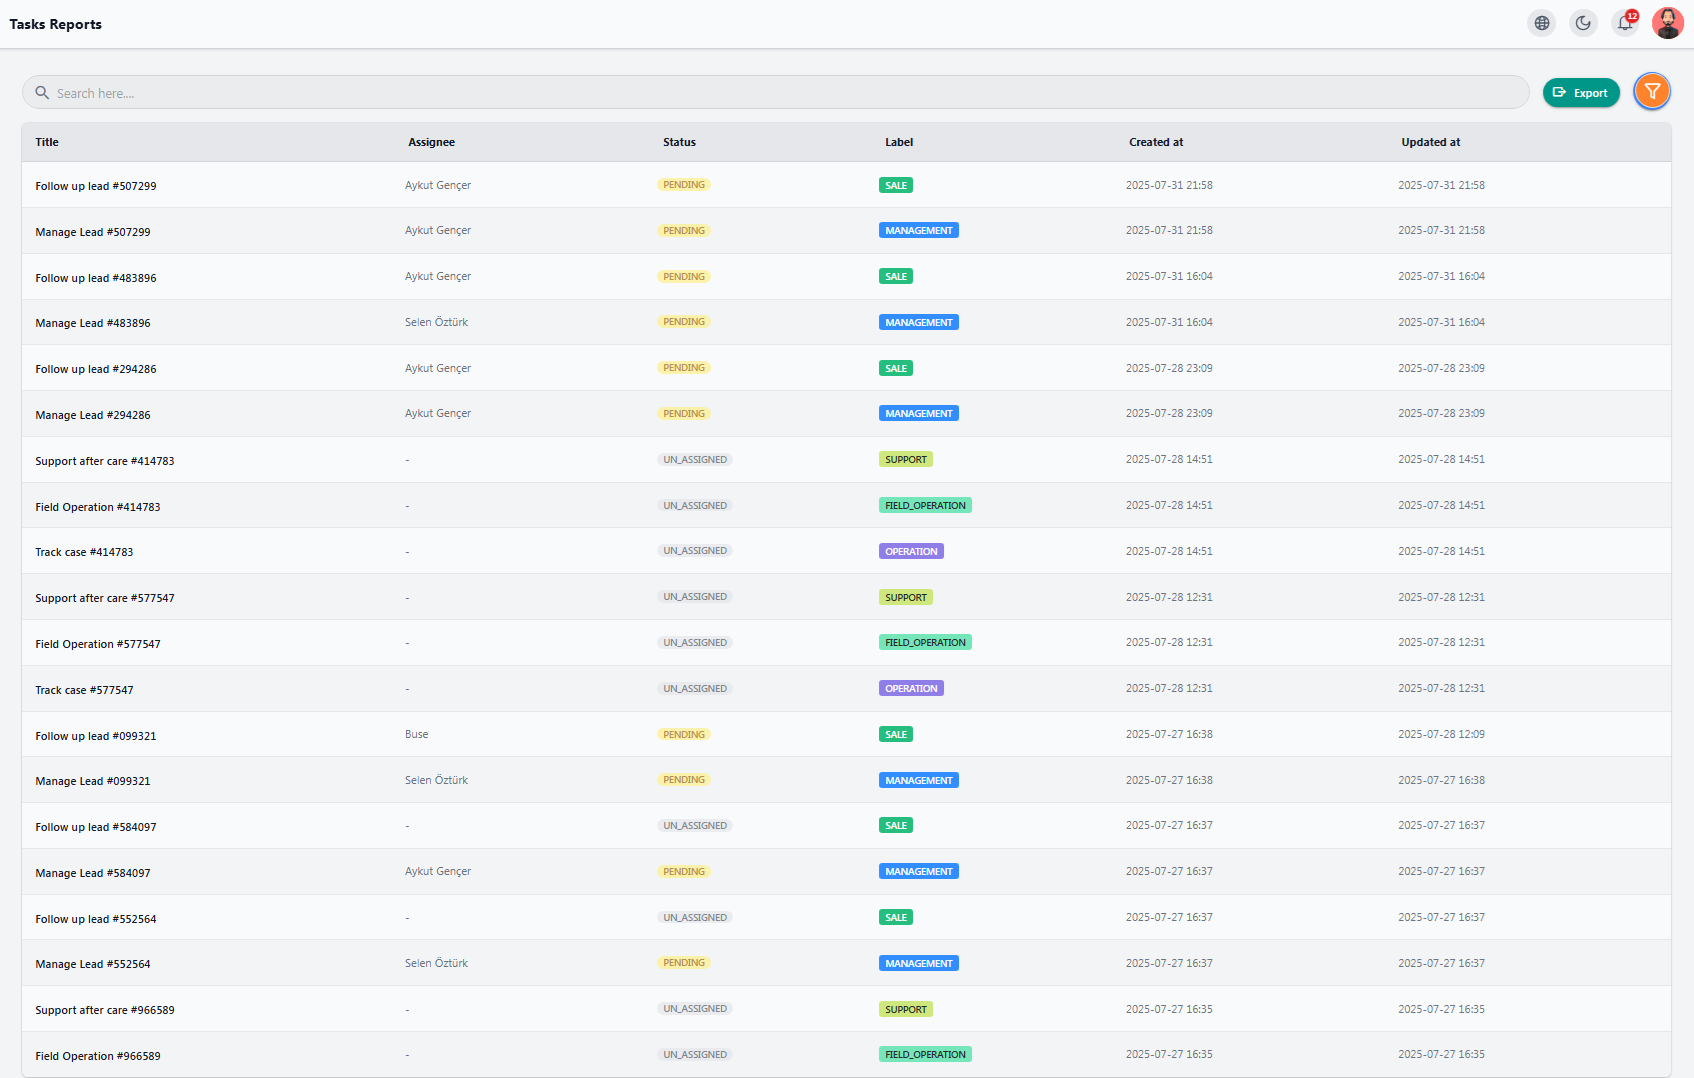
Table Columns #
• Title – Short description of the task
• Assignee – Person responsible
• Status – e.g., pending, in progress
• Label – Role the task is assigned to
• Created at – Date/time of task creation
• Updated at – Last update time
You can filter, categorize, and export (Export button) tasks to ensure full completion.
💼 Sales Reports #
Gives a complete overview of the sales performance, allowing you to analyze revenue, profit, average sale value, and salesperson efficiency.
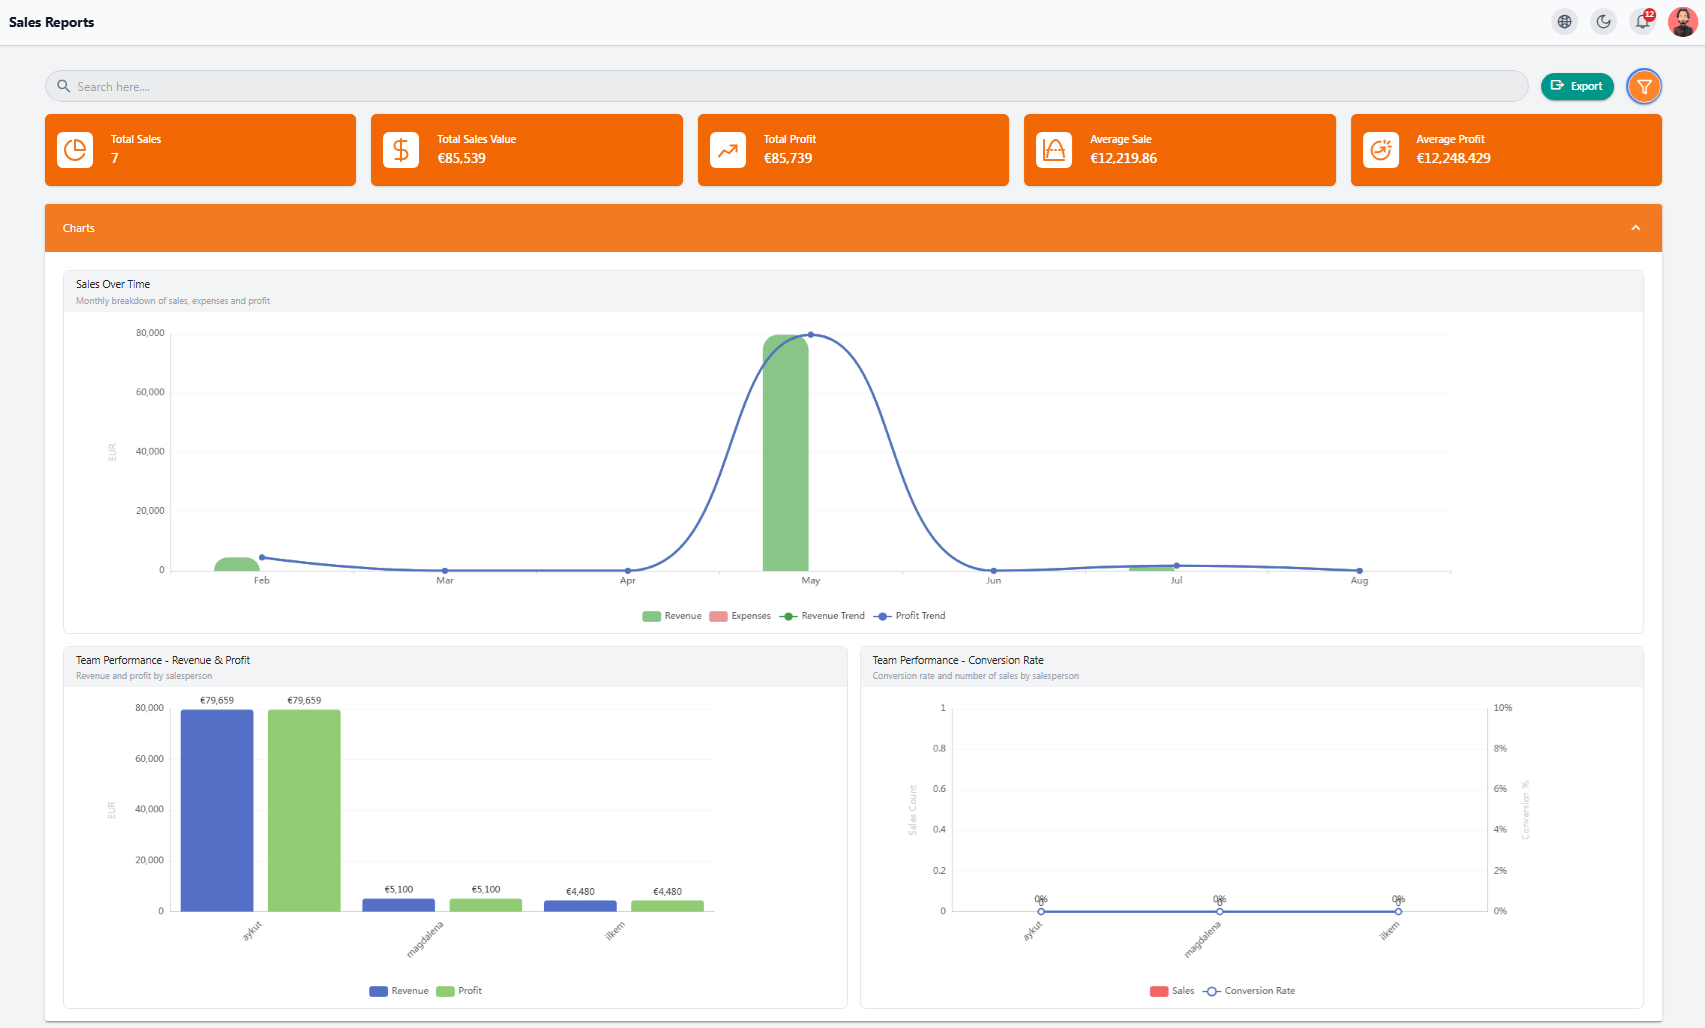
Main KPIs #
• Total Sales
• Total Sale Value
• Total Profit
• Average Sale
• Average Profit
Charts #
• Sales Over Time – Monthly revenue & profit trend (line chart)
• Team Performance – Profit/revenue comparison per salesperson
• Conversion Rate – Lead-to-sale percentage for each salesperson
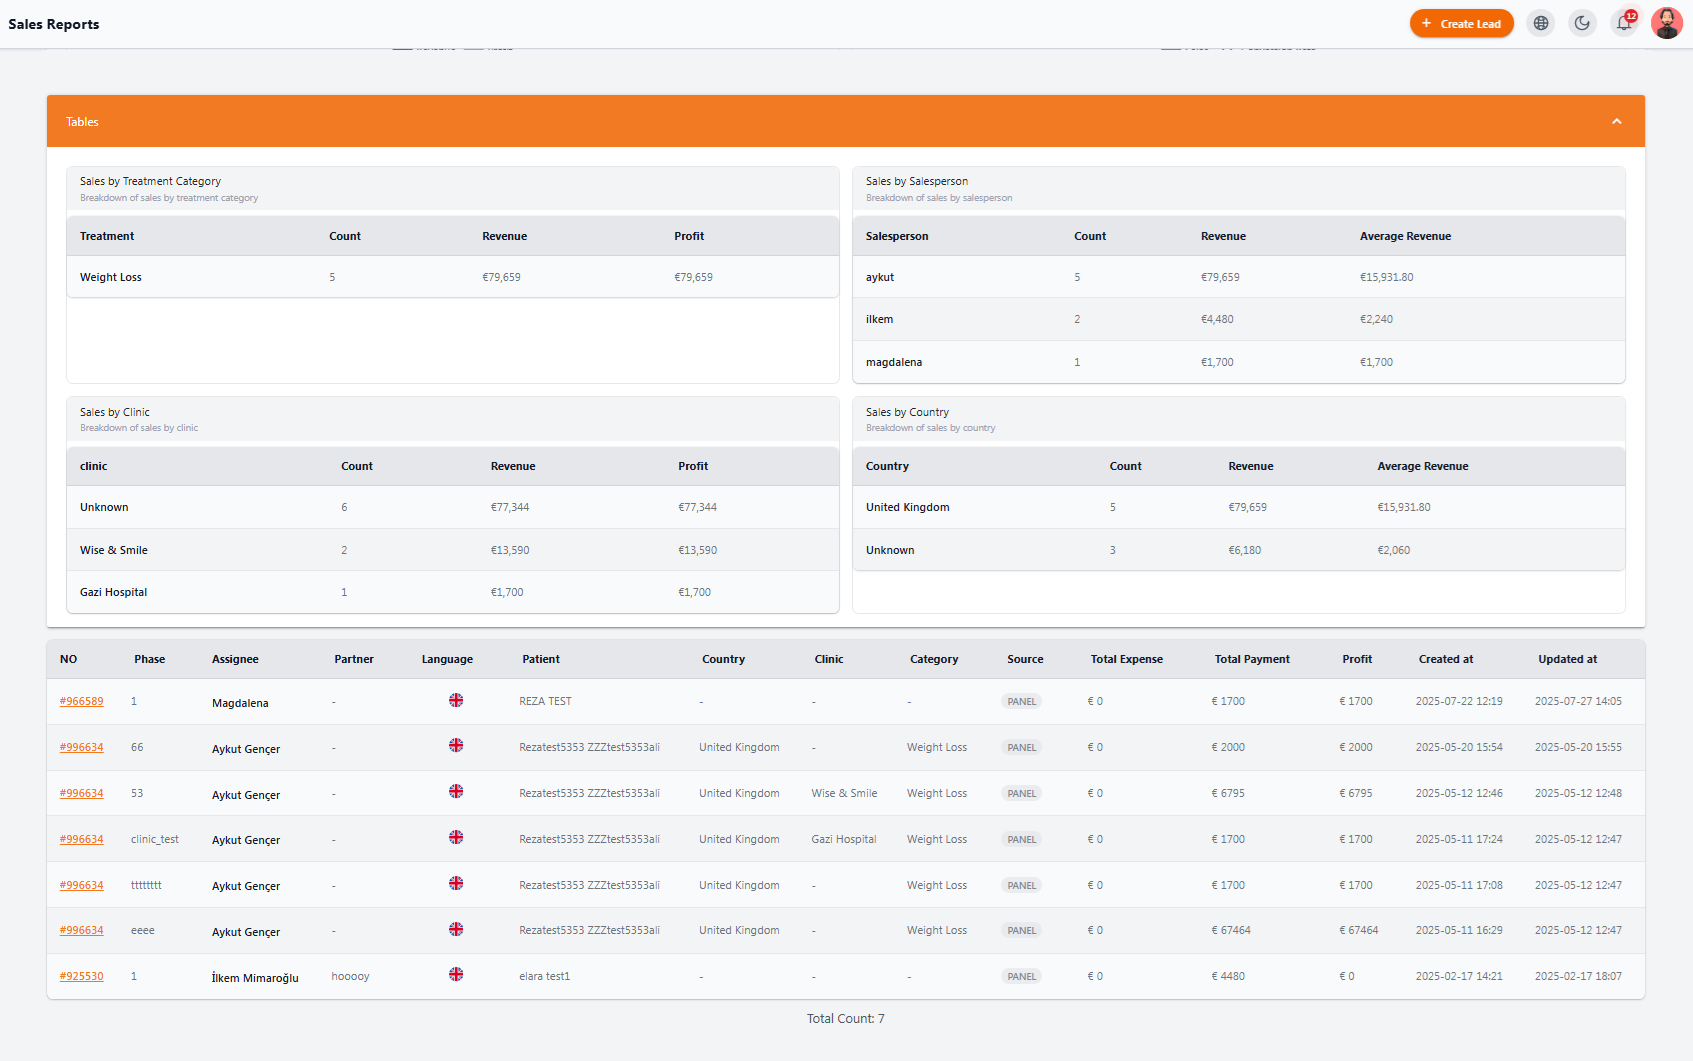
Data Tables #
Breakdowns by:
• Treatment category
• Salesperson
• Clinic
• Country
Sales Details List – Full list of sales with phase, patient, country, clinic, paid amount, final profit, and dates. Data can be exported.
💰 Financial Reports #
A key tool for tracking income, expenses, and net balance in real time.
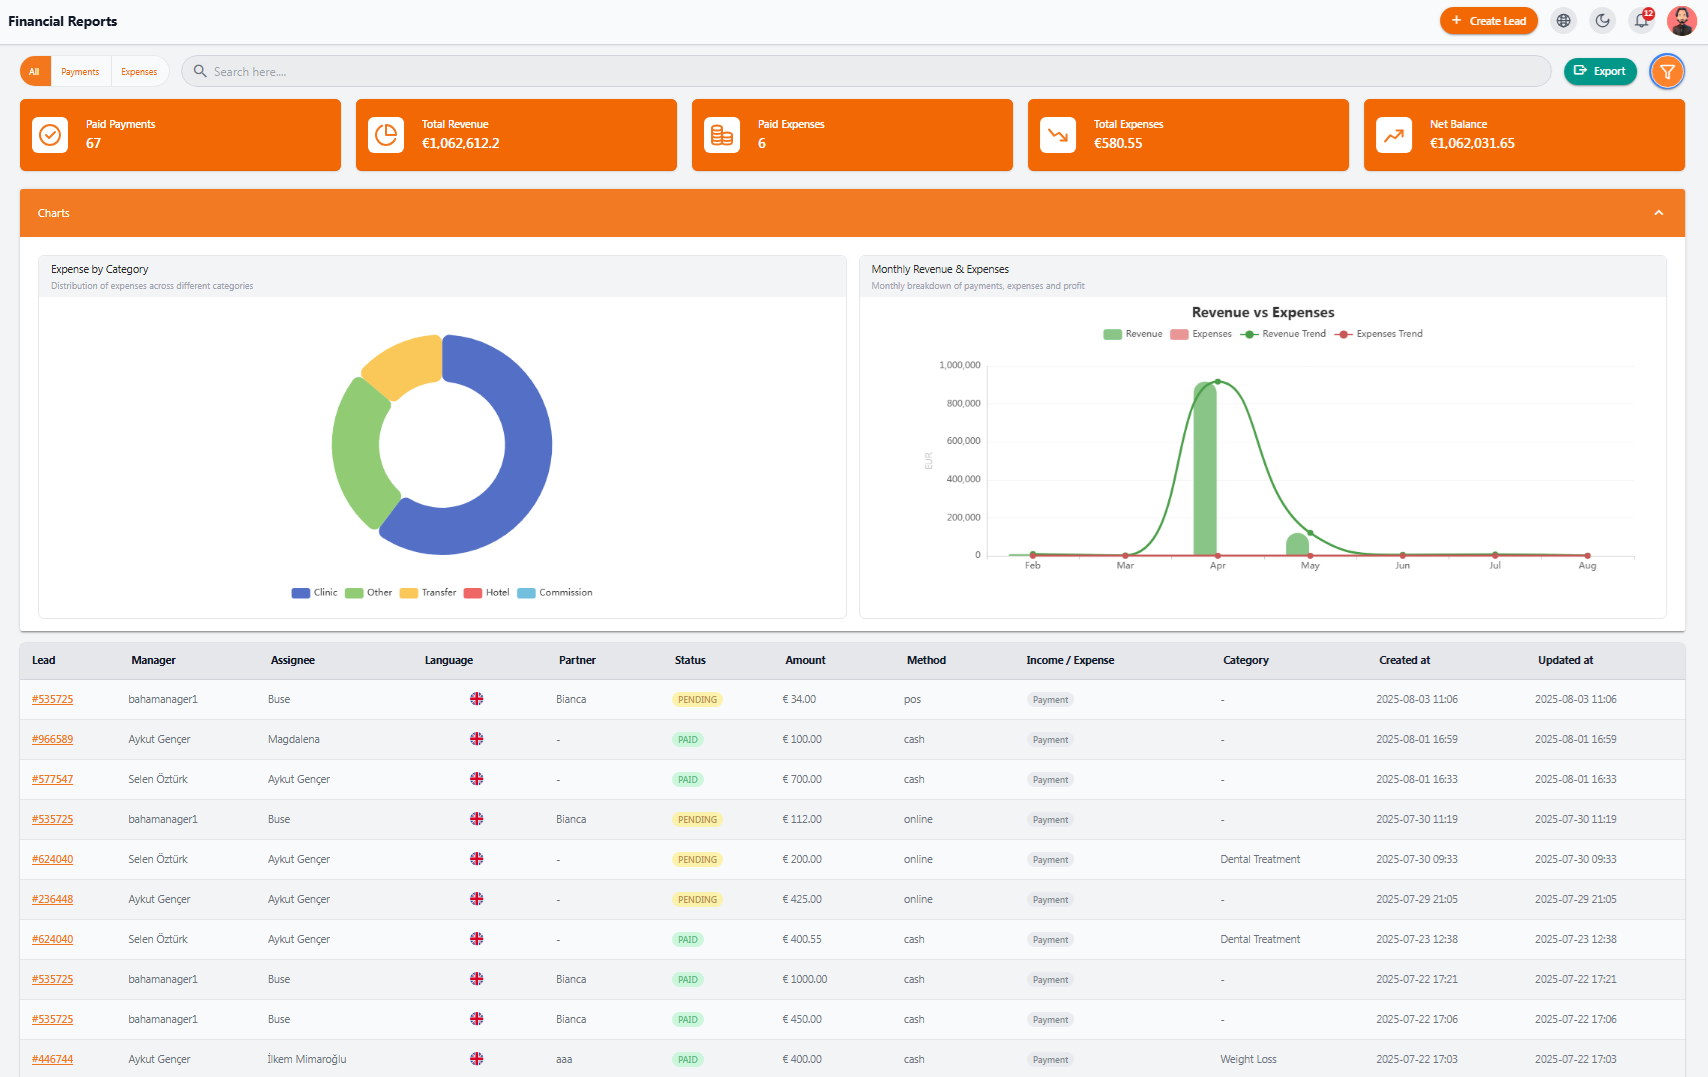
Main Indicators #
• Paid Payments
• Total Revenue
• Paid Expenses
• Total Expenses
• Net Balance
Charts #
• Expense by Category – Percent breakdown (clinic, hotel, transfer, commission, other)
• Monthly Revenue & Expenses – Monthly comparison line chart
Transactions Table – Shows related lead, manager, status, amount, payment method, type (income/expense), category, creation date, last update.
Export available for accounting and management.
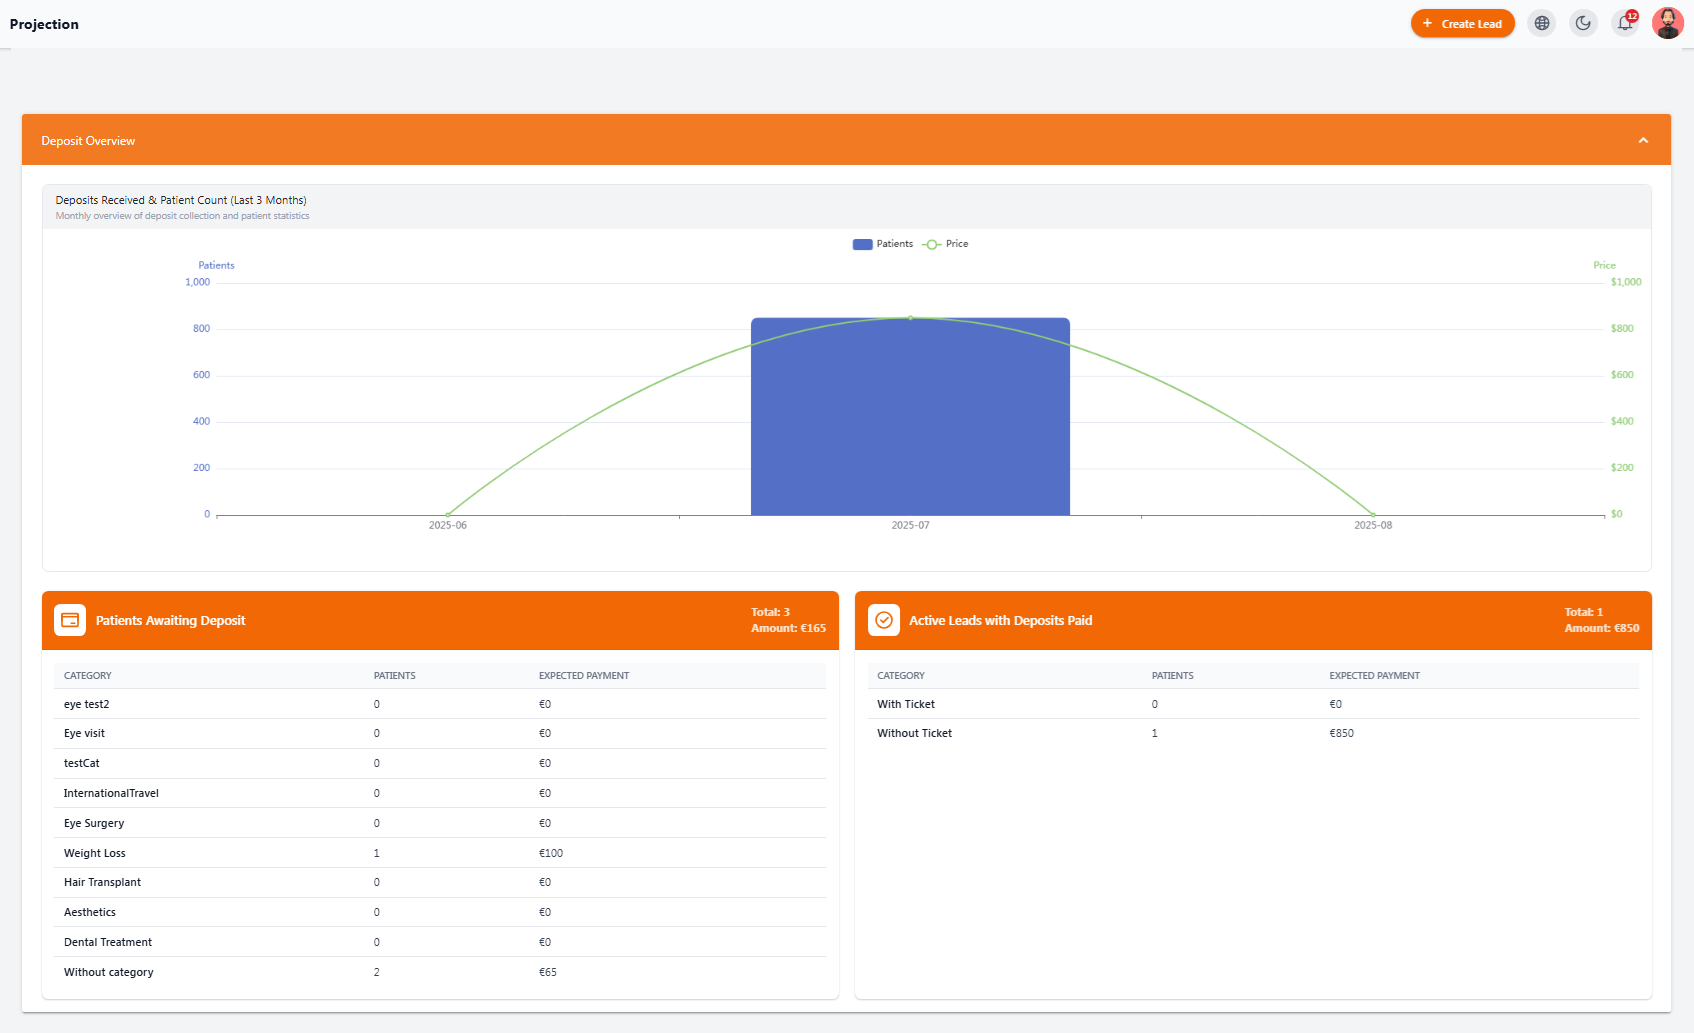
📅 Projection Reports #
Provides an overview of expected future operations, such as upcoming patients, forecasted payments, and anticipated deposits.
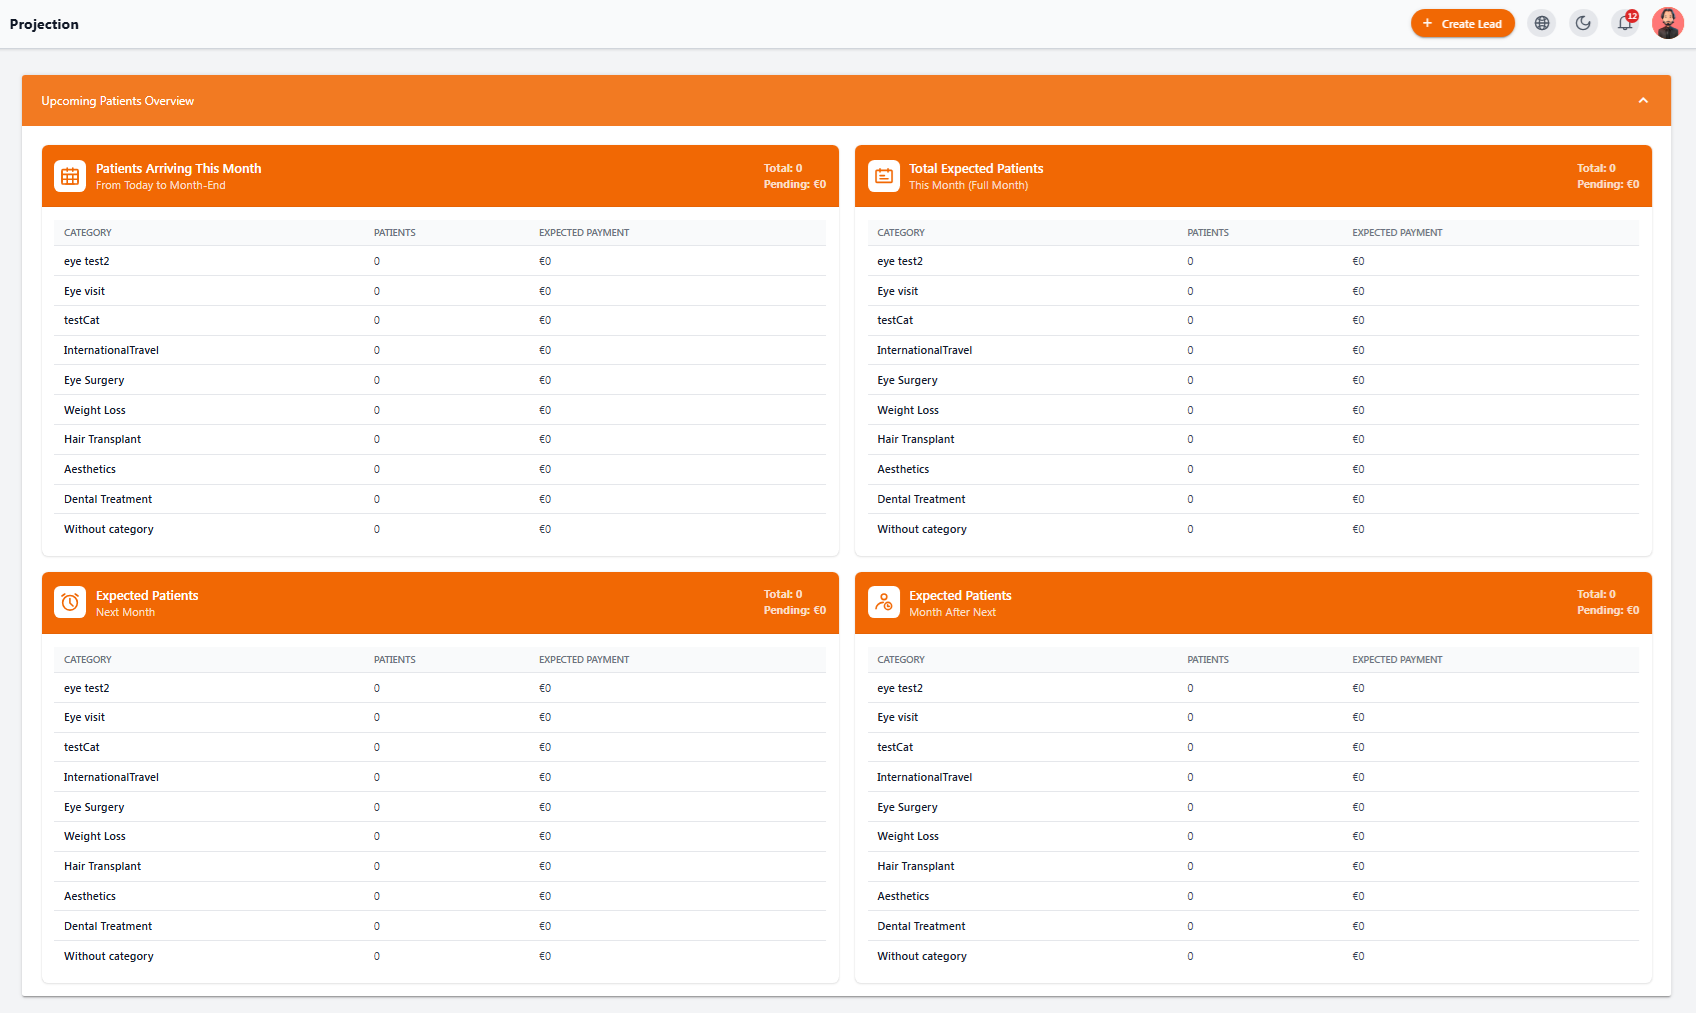
This Month’s Patients #
List of patients scheduled to visit the clinic by month’s end, with expected revenue.
Expected Patients #
Shows:
• Patient count per month
• Treatment categories
• Estimated amounts to be received
Deposit Status #
Report of:
• Deposit trends in the last 3 months
• Patients awaiting deposits
• Active leads who have made a deposit