
Manager Dashboard #
The Manager Dashboard in NexaPortal provides a clear overview of recent leads, activities, and last 3 months’ statistics to the Manager. This page allows managers to view notifications, new leads, and performance charts without navigating away.
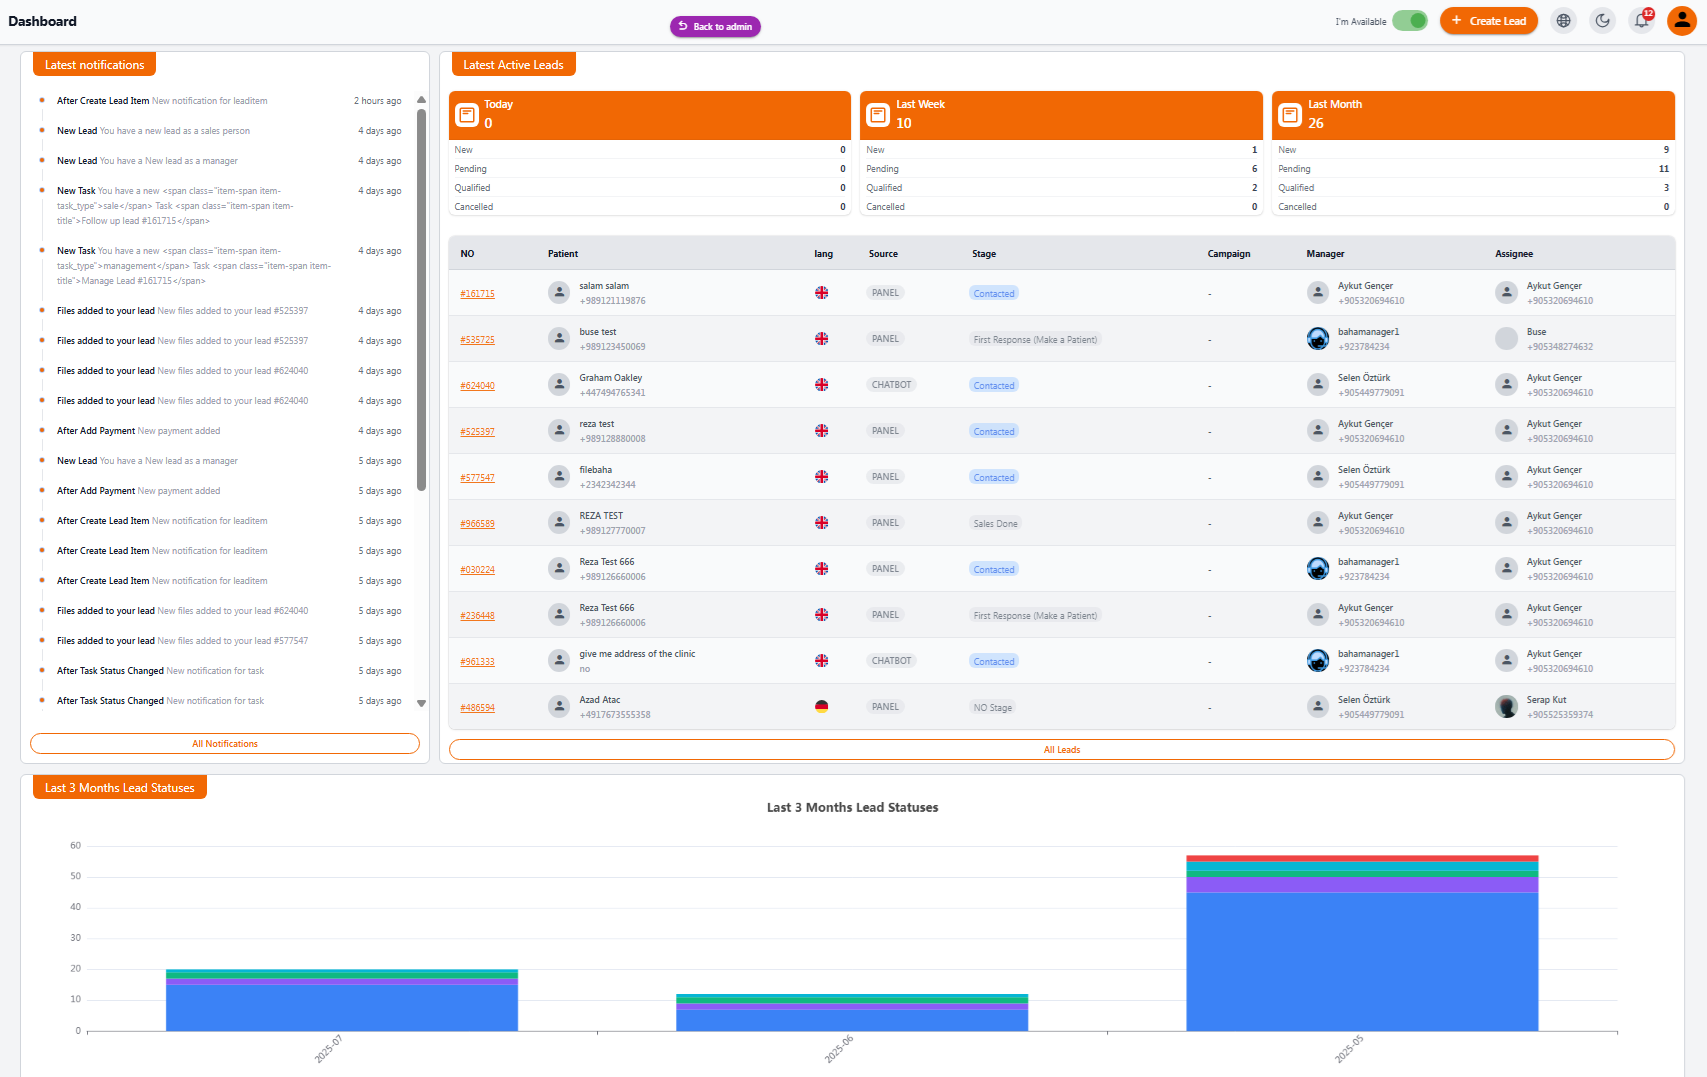
1️⃣ Latest Notifications #
On the left column, you can see a list of the most recent notifications, including key events:
• New lead created
• File added to a lead
• Task created or updated
• New payment registered
➡️ Click All Notifications to view the complete notifications page.
2️⃣ Latest Active Leads #
In the central section, you get a quick overview of active leads.
📊 Lead Stats #
Above the leads table, you’ll see stats for New, Pending, Qualified, and Cancelled leads in the timeframes: Today, Last Week, and Last Month.
🗂️ Leads Table #
The table includes the following info:
• Lead Number
• Message or Patient Name
• Lead Language
• Source (Panel or Chatbot)
• Current Stage
• Campaign (if any)
• Lead Manager
• Assignee
➡️ Click All Leads to view your full lead list.
3️⃣ Lead Status Chart (Last 3 Months) #
At the bottom of the page, a bar chart shows lead status breakdown for the last 3 months, categorized by month and stage:
New/Pending
Sale Done
Qualified
Done
Cancel/Spam
📝 Note: All data is automatically and live updated 🔄


