
In the Reports section of the Admin Panel, you can access and view detailed statistics of various system components.
The Reports section is divided into 5 main parts:
📋 Leads Reports #
The Leads Reports section in the NexaPortal is a powerful tool for evaluating sales team performance, tracking lead sources, and analyzing customer conversion trends. It’s designed to be highly visual and intuitive, giving you a clear view of the journey from lead acquisition to final sale at a glance.
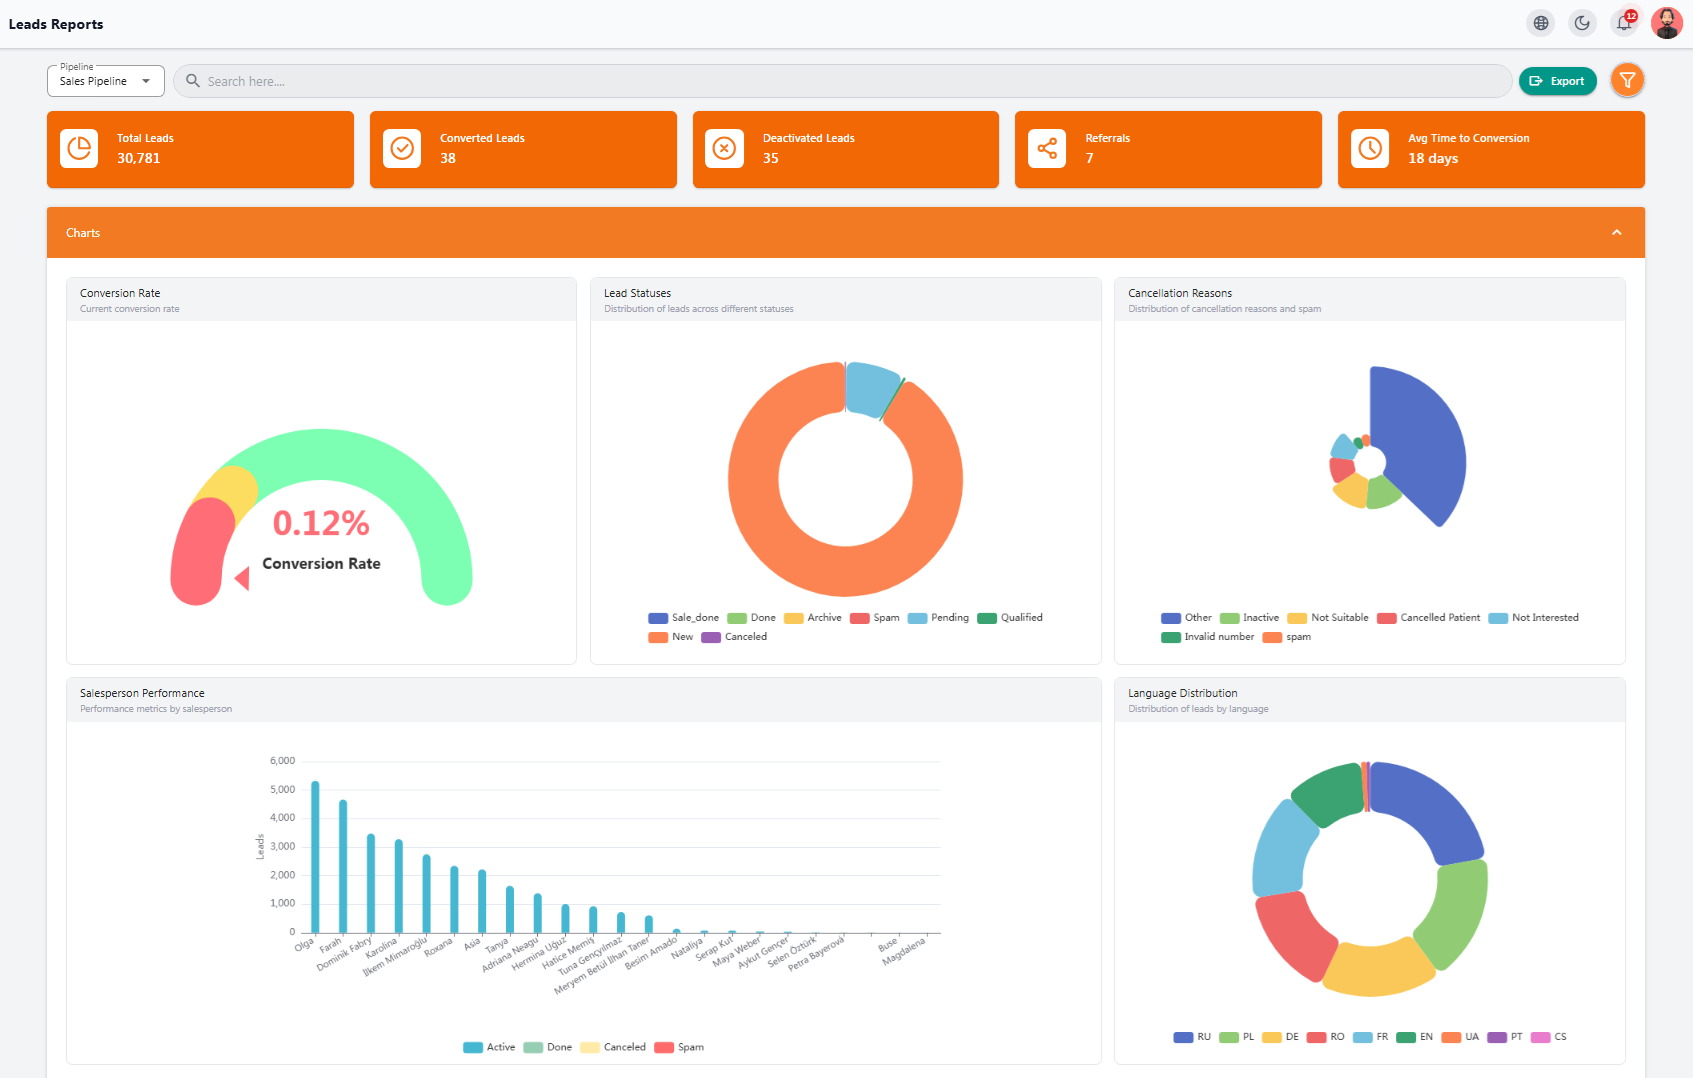
🔸 Key Metrics at the Top #
-
Total Leads: All registered leads
-
Converted Leads: Leads that resulted in successful sales
-
Deactivated Leads: Inactive or canceled leads
-
Referrals: Leads referred by others
-
Avg Time to Conversion: Average time it takes to convert a lead into a customer
📈 Analytical Charts #
-
Conversion Rate: Success rate of turning leads into customers
-
Lead Statuses: Overview of all current lead statuses
-
Cancellation Reasons: Detailed analysis of why leads failed to convert
-
Salesperson Performance: Compare activities and efficiency of your sales team
-
Language Distribution: Lead languages to identify target markets
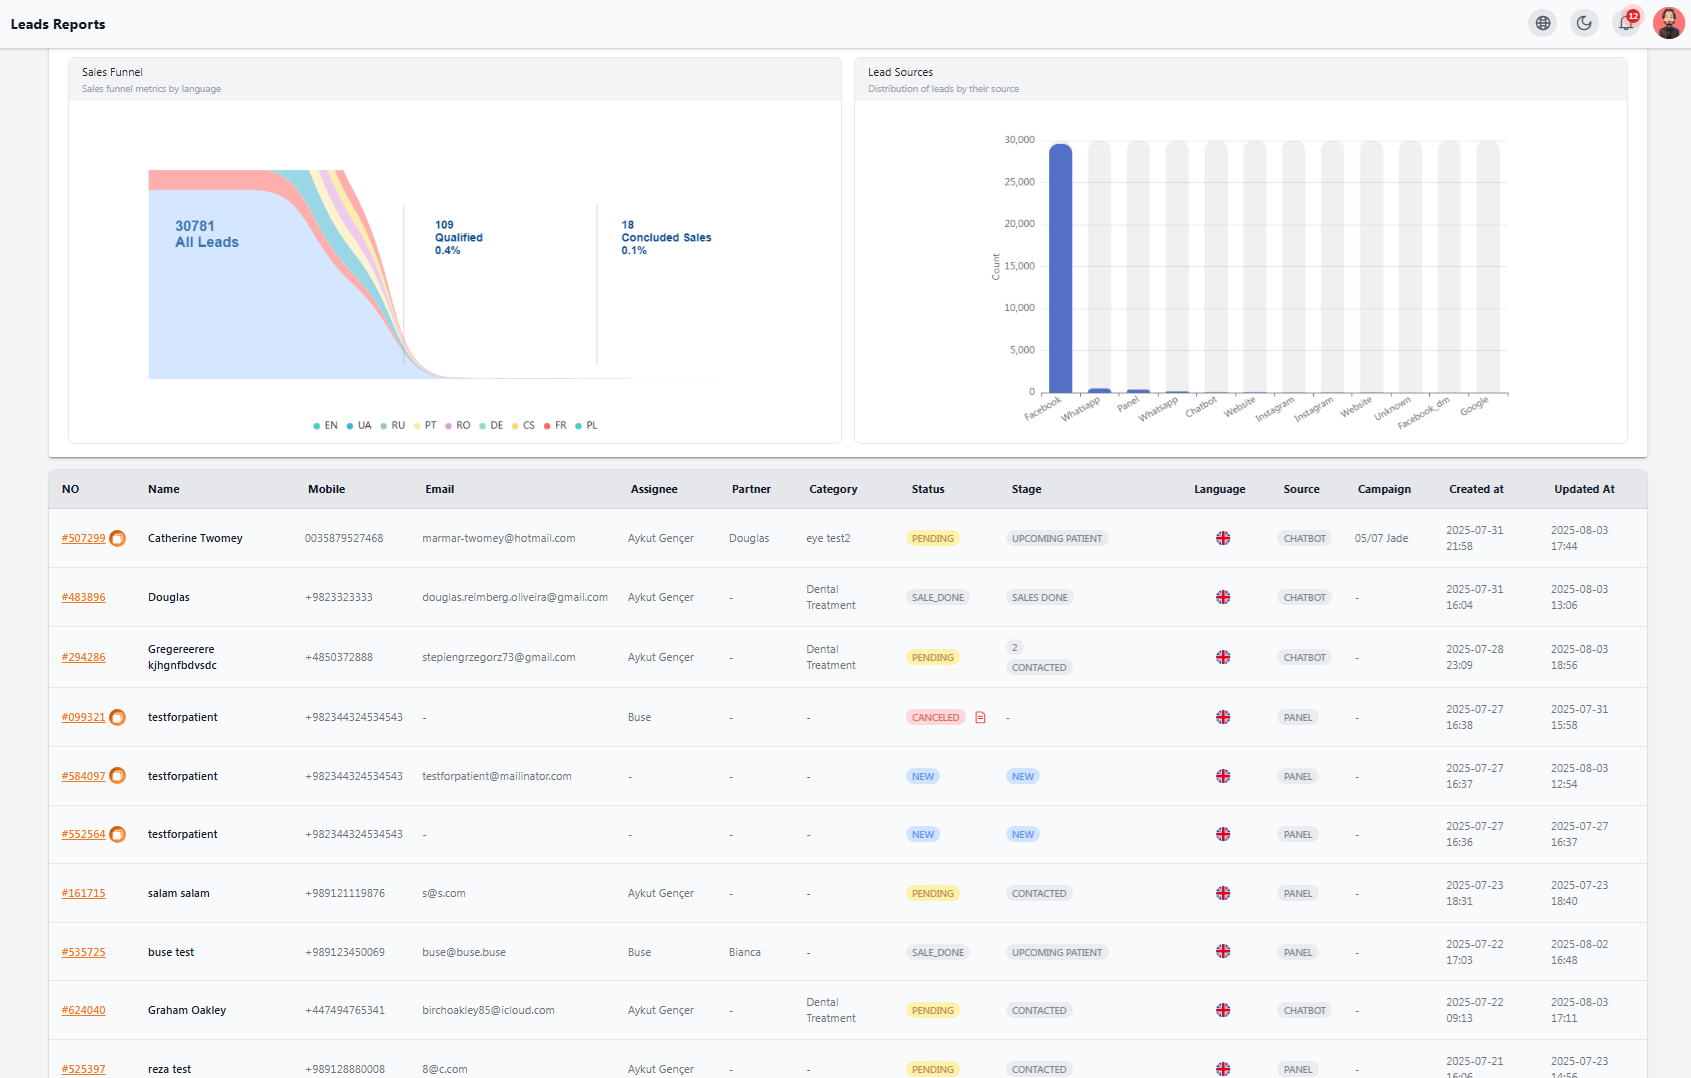
🔻 Sales Funnel #
A funnel chart showing the journey of leads from entry to final sale, segmented by language.
📊 Lead Sources #
Displays channels like WhatsApp, Facebook, Website, Google, etc., from which leads have entered the system.
📋 Leads Table #
At the bottom of the page, you’ll find a complete list of leads, including:
-
Name, phone number, email
-
Assigned salesperson, category, status, and stage
-
Language, source, campaign, creation and update date
🔍 This section is designed for in-depth analysis, professional reporting, and quick decision-making — ensuring your sales process always stays on the optimal track
✅ Tasks Reports #
The Tasks Reports section in NexaPortal is a smart and practical tool for tracking, managing, and closely monitoring all tasks registered in the system. This module helps you instantly view task progress, assigned personnel, and activity types enabling you to take quick action when needed.
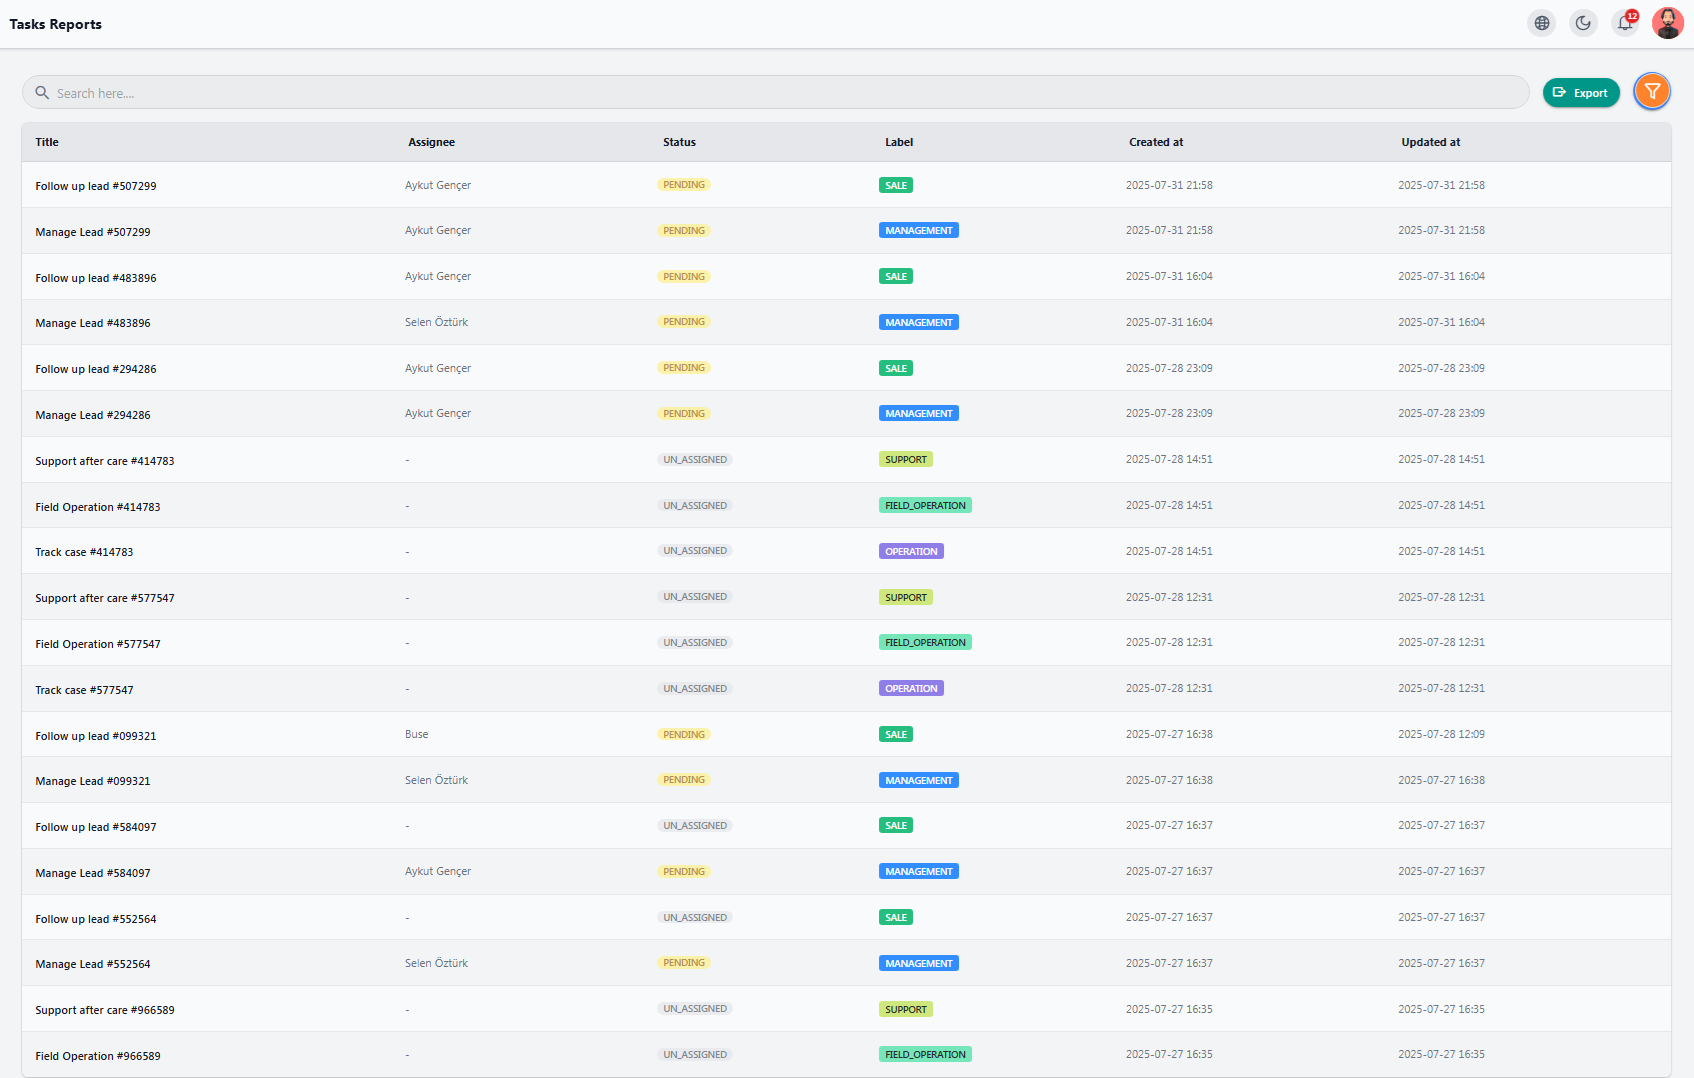
📌 Table Information #
-
Title: A short description of the task
-
Assignee: The person responsible for completing the task
-
Status: Current task status (e.g., pending, in progress, etc.)
-
Label: The role or category the task is assigned to
-
Created at: Date and time the task was registered
-
Updated at: Timestamp of the latest update made to the task
🔍 This report allows you to filter tasks, export the data if needed, and make sure all assignments are completed on time
💰 Sales Reports #
The Sales Reports section gives you a clear and comprehensive overview of your organization’s sales performance. It helps you accurately monitor and analyze profit, revenue, average sales, and the overall performance of your sales team
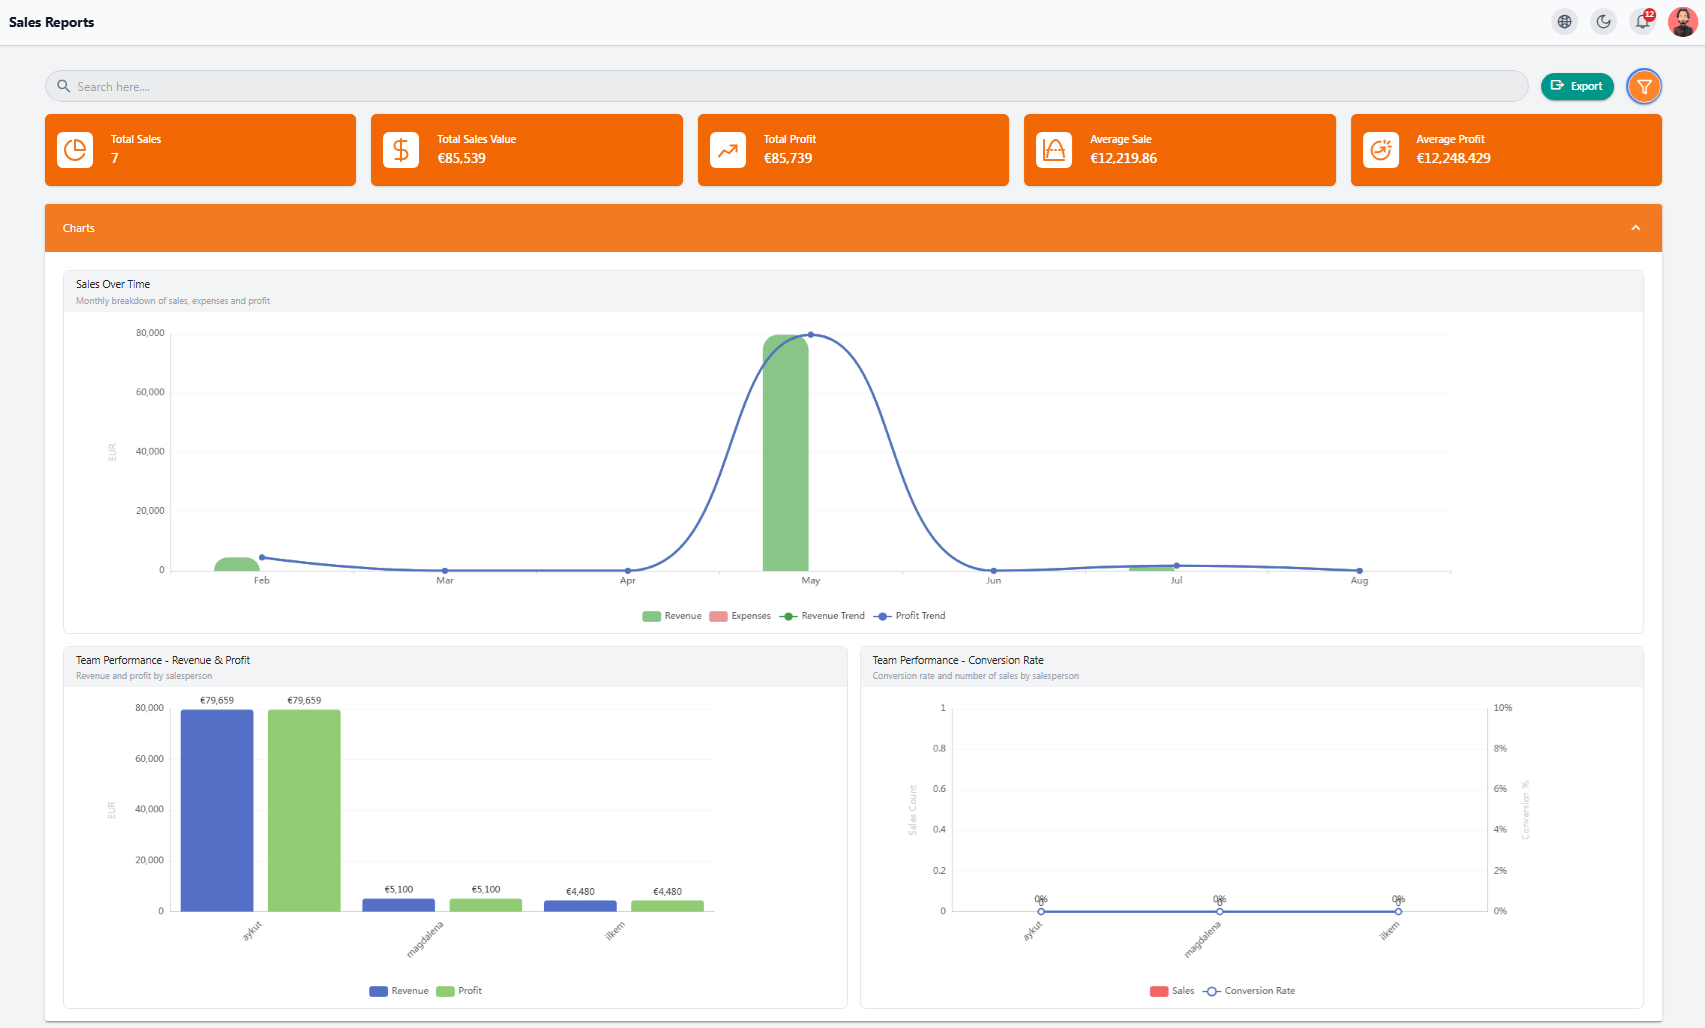
🔸 Key Metrics #
-
Total Sales: Number of all completed sales
-
Total Sale Value: Total revenue generated
-
Total Profit: Total profit earned
-
Average Sale: Average value per sale
-
Average Profit: Average profit per sale
📅 Statistical Charts #
-
Sales Over Time:
Line chart showing revenue and profit trends on a monthly basis -
Team Performance:
Compare revenue and profit for each salesperson -
Conversion Rate:
Percentage of leads converted into final sales for each sales agent
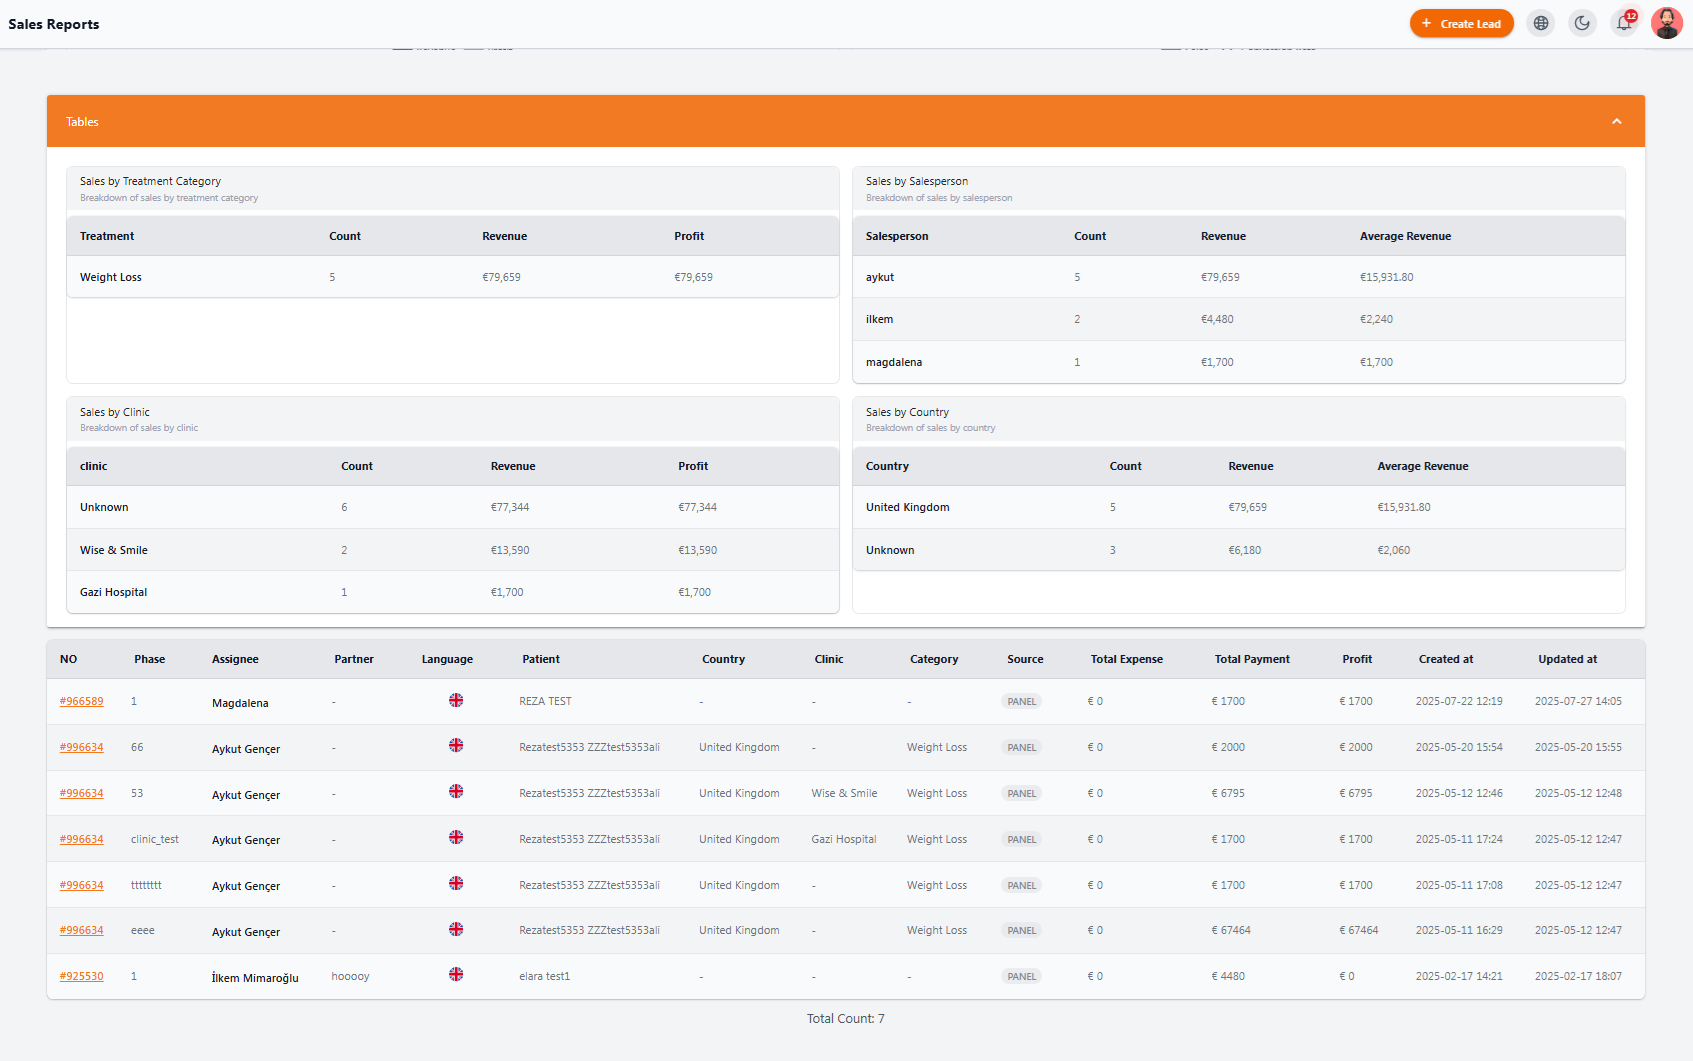
📋 Statistical Tables #
-
By Treatment Category
-
By Salesperson
-
By Clinic
-
By Country
These insights help you identify profitable sources and make smarter business decisions
🧾 Sales Details List #
At the bottom of the page, you can view a detailed list of all sales, including:
-
Sales phase, patient, country, clinic
-
Payment amount, final profit, and relevant dates
🔍 You can also use the Export button to download this data and include it in management reports
🧾 Financial Reports #
The Financial Reports section is one of the most essential financial management tools in the NexaPortal. It allows you to analyze income, expenses, and your net financial balance in real time
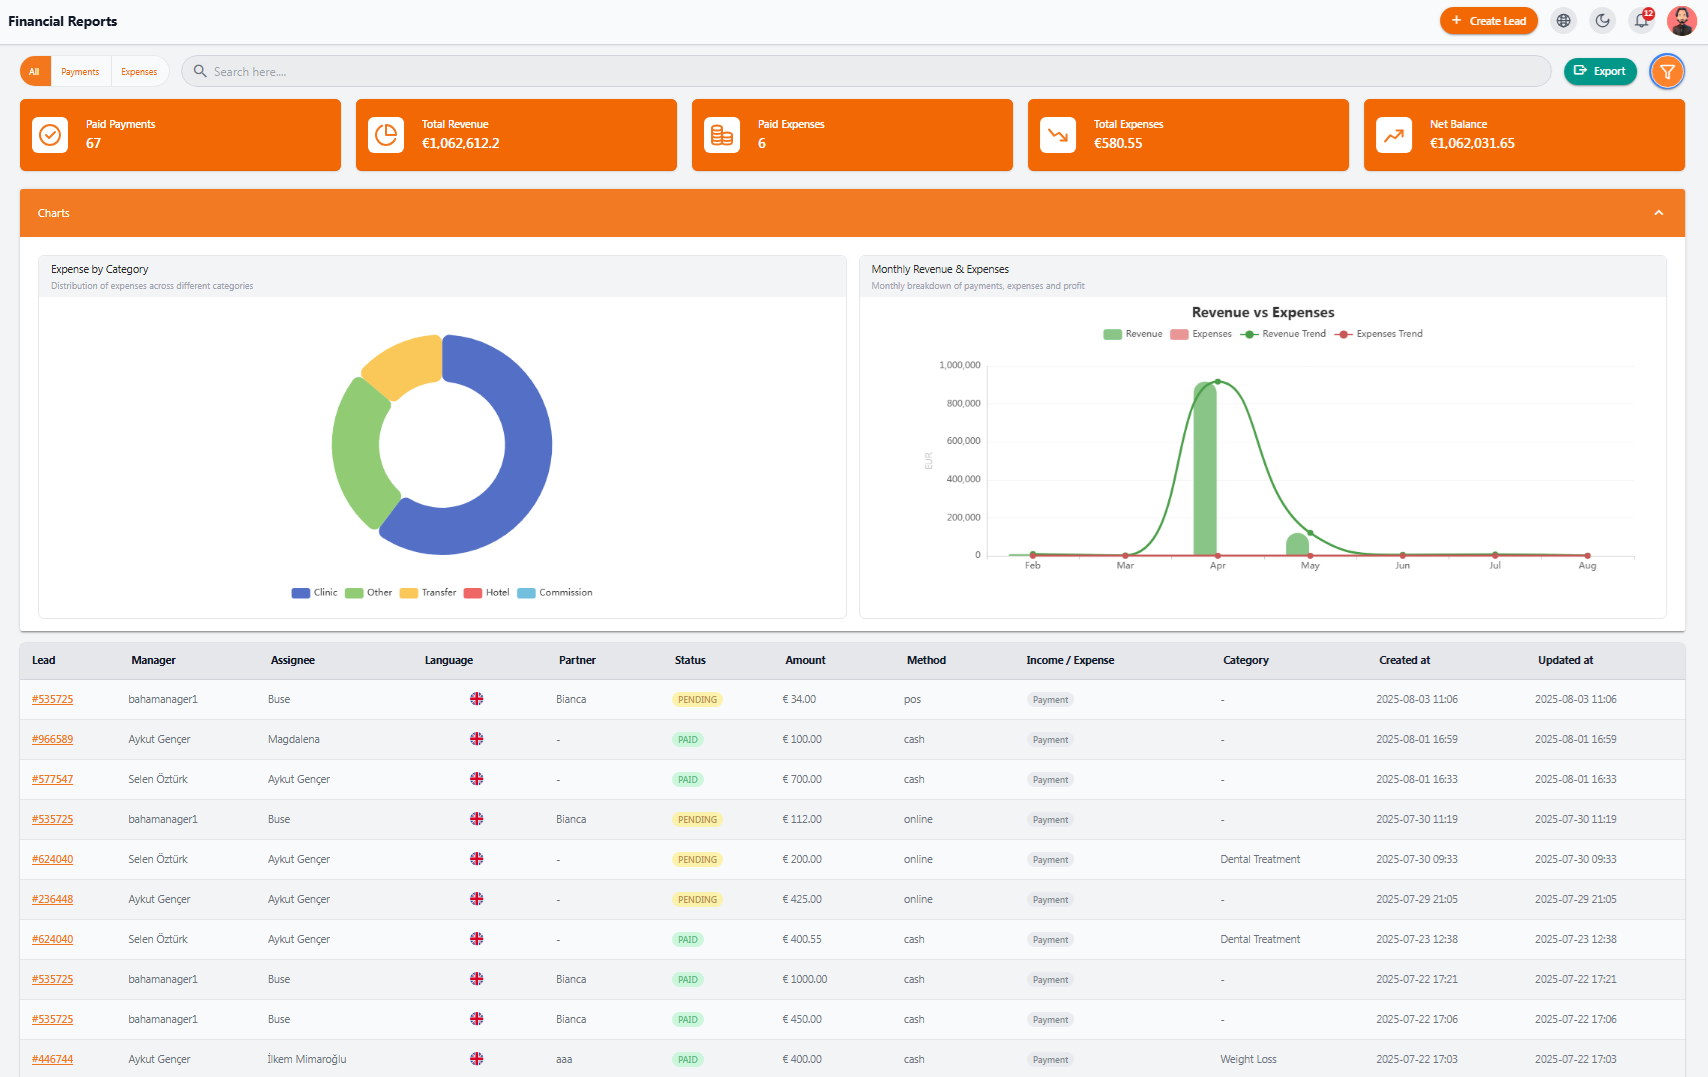
🔸 Key Metrics #
-
Paid Payments: Number of confirmed payments
-
Total Revenue: Total income generated
-
Paid Expenses: Number of expenses paid
-
Total Expenses: Sum of all expenses
-
Net Balance: Final financial balance
📊 Charts #
-
Expense by Category:
View expense distribution across categories such as Clinic, Hotel, Transfer, Commission, and others -
Monthly Revenue & Expenses:
A line chart comparing income and expenses across different months
📋 Transaction Table #
At the bottom of the page, all recorded financial transactions are displayed with detailed data including:
-
Related lead
-
Manager and handler
-
Status (Paid / Pending)
-
Amount and payment method
-
Transaction type (Income / Expense)
-
Income/expense category
-
Creation and last update dates
All fields are filterable for quick access and review
📤 You can also export the data for use in management or accounting reports easily!
🔮 Projection Reports #
In this section, you get a forward-looking view of your operations — including upcoming patients, forecasted payments, and expected deposits. These insights help you gain a clear picture of your clinic’s future, both financially and operationally.
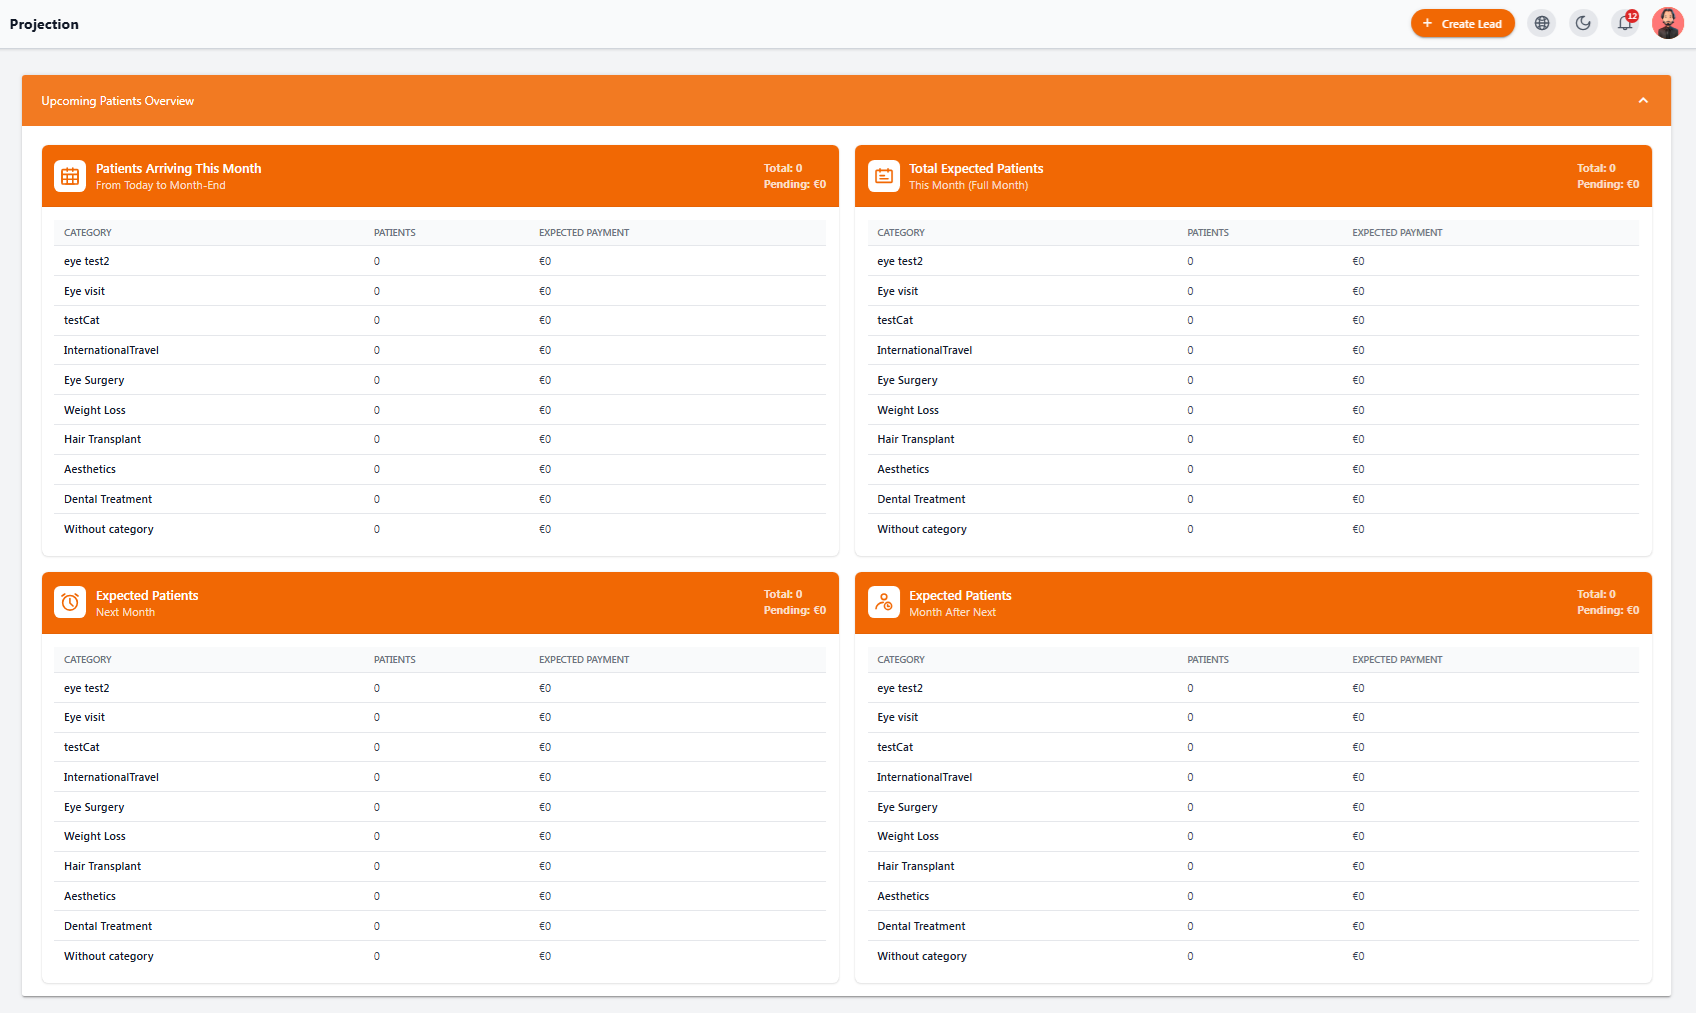
📅 Patients This Month #
This table lists all the patients expected to visit the clinic by the end of the month, along with the estimated amount anticipated to be received from them
🔮 Expected Patients #
Divided into three key sections, this area shows:
-
Number of patients expected each month
-
Their treatment categories
-
The approximate revenue expected from these services
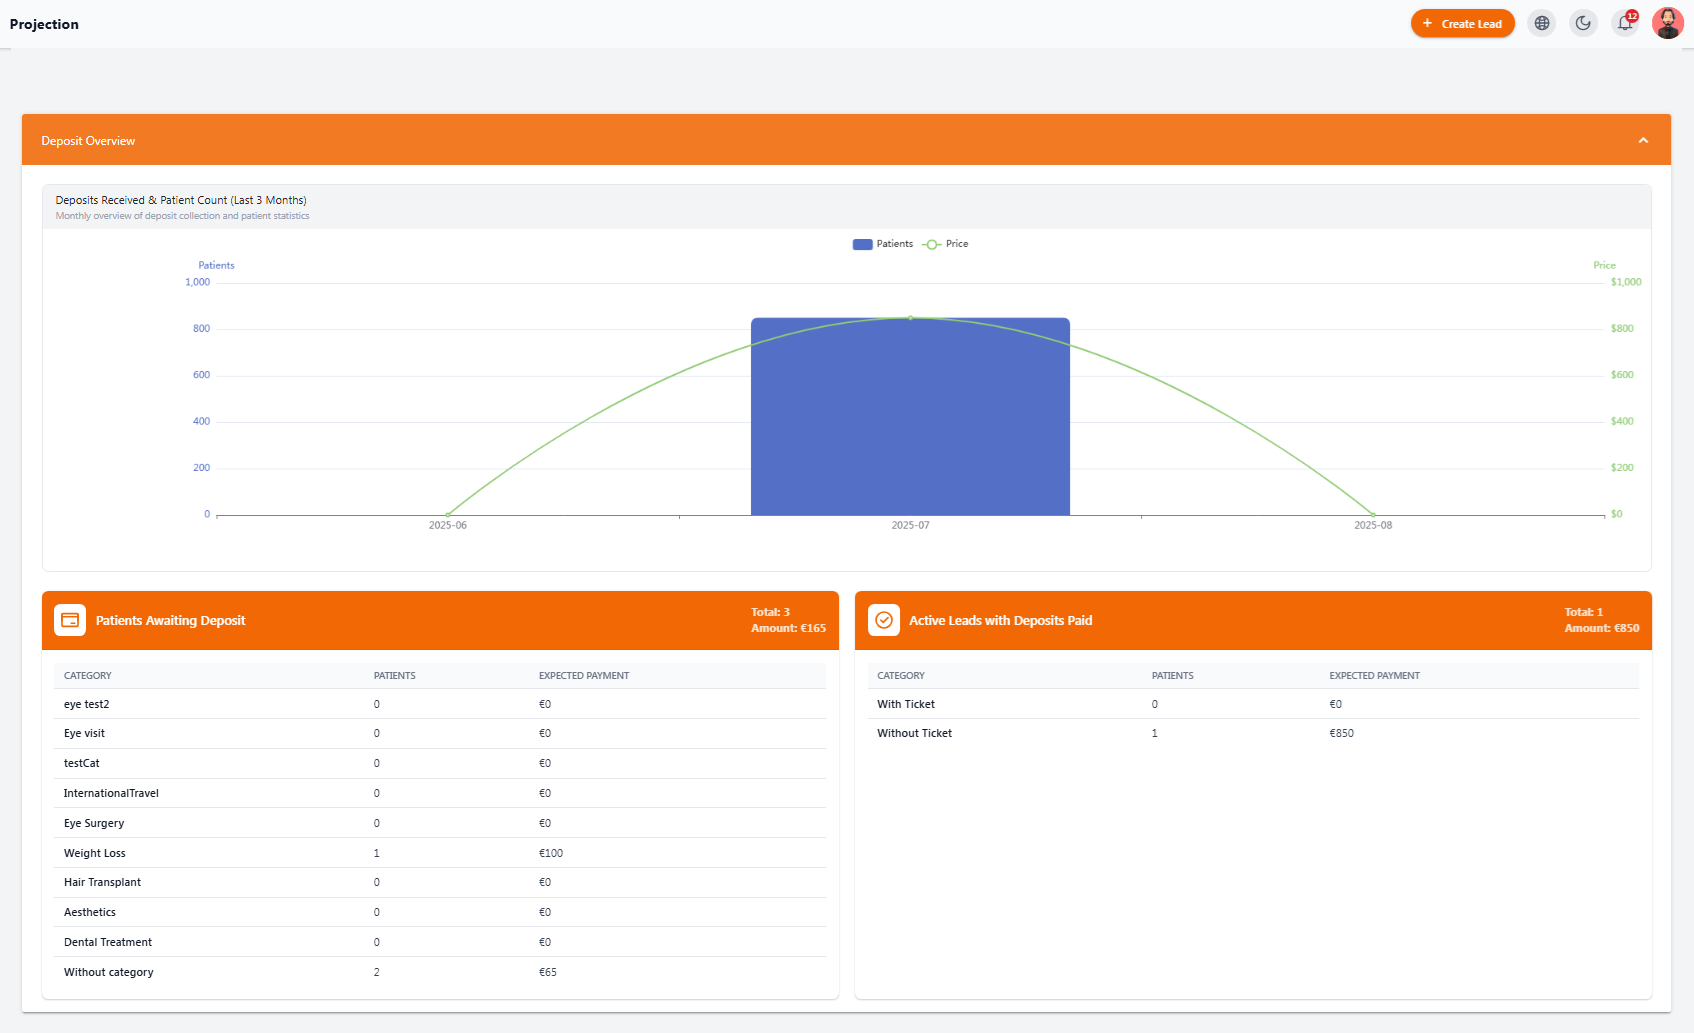
💰 Deposit Status #
This part provides a detailed report on:
-
The trend of received deposits over the past 3 months
-
Patients who are awaiting deposit (haven’t paid their prepayment yet)
-
Active leads who have already made a deposit
🔍 With this information, you can plan smarter, manage resources better, and stay financially prepared!


