
Admin Dashboard #
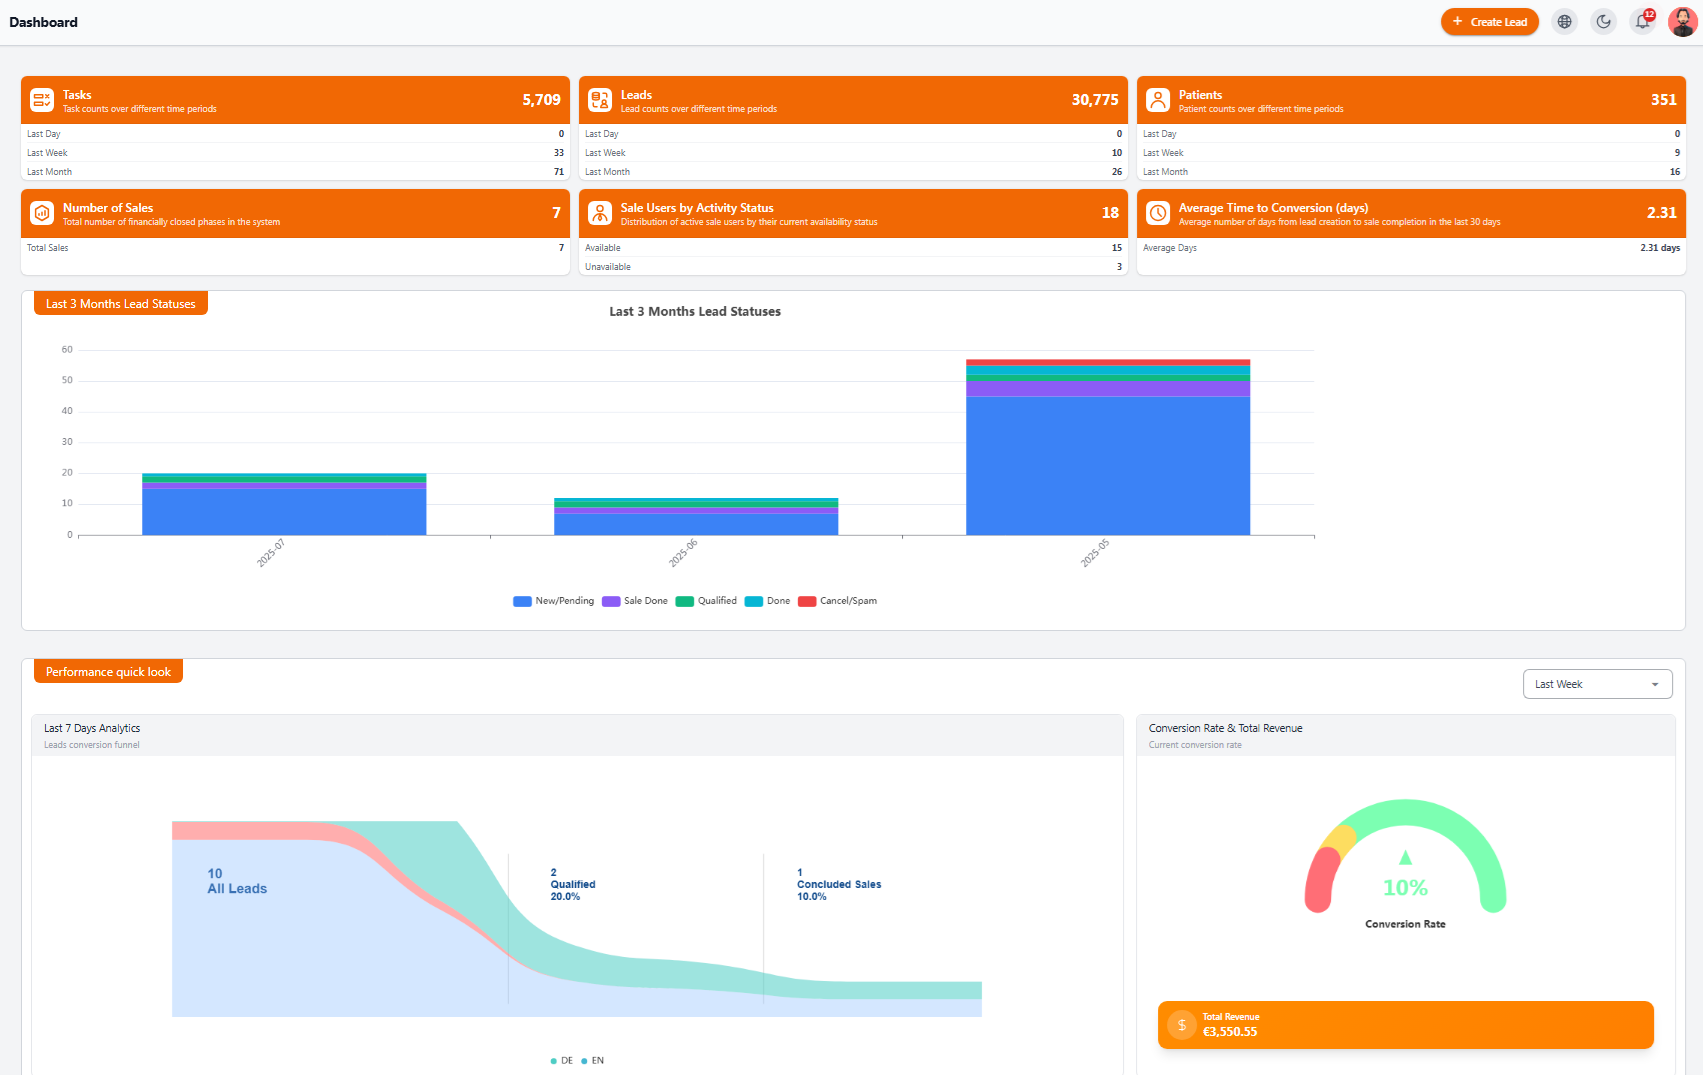
The Admin Dashboard in NexaPortal provides a comprehensive overview of the entire system. It helps you instantly monitor real-time statistics of Leads, Tasks, Patients, Sales Users, Conversion Time, and Performance Charts all in one place.
 Statistical Boxes (Overall System Stats) #
At the top of the dashboard, there are 6 key statistical boxes:
| Title | Description |
|---|---|
| Tasks | Number of registered tasks in different periods (day, week, month) |
| Leads | Number of leads entered into the system across different timeframes |
| Patients | Number of patients registered daily, weekly, or monthly |
| Number of Sales | Total closed financial phases counted as final sales |
| Sale Users by Activity Status | Number of active and inactive sales users |
| Average Time to Conversion | Average time (in days) it took for leads to convert to sales |
 Lead Status Chart (Last 3 Months)
A 3-month bar chart is displayed in the center of the page, showing lead status breakdown per month:
New/Pending
Sale Done
Qualified
Done
Cancel/Spam
 System Performance Quick Look #
At the bottom of the page, you’ll see two important boxes:
 Leads Conversion Funnel #
Shows how leads progressed over the past 7 days:
-
Number of leads entered
-
How many were Qualified
-
How many were Sold (finalized)
 Conversion Rate & Total Revenue #
-
Conversion rate from lead to sale (as %)
-
Total revenue (based on your system’s currency, e.g., Euro)
 Note: All data is live and auto-updated


