
Admin Dashboard #
The Admin Dashboard in NexaPortal provides a comprehensive overview of the entire system. It helps you instantly monitor real-time statistics of Leads, Tasks, Patients, Sales Users, Conversion Time, and Performance Charts all in one place.
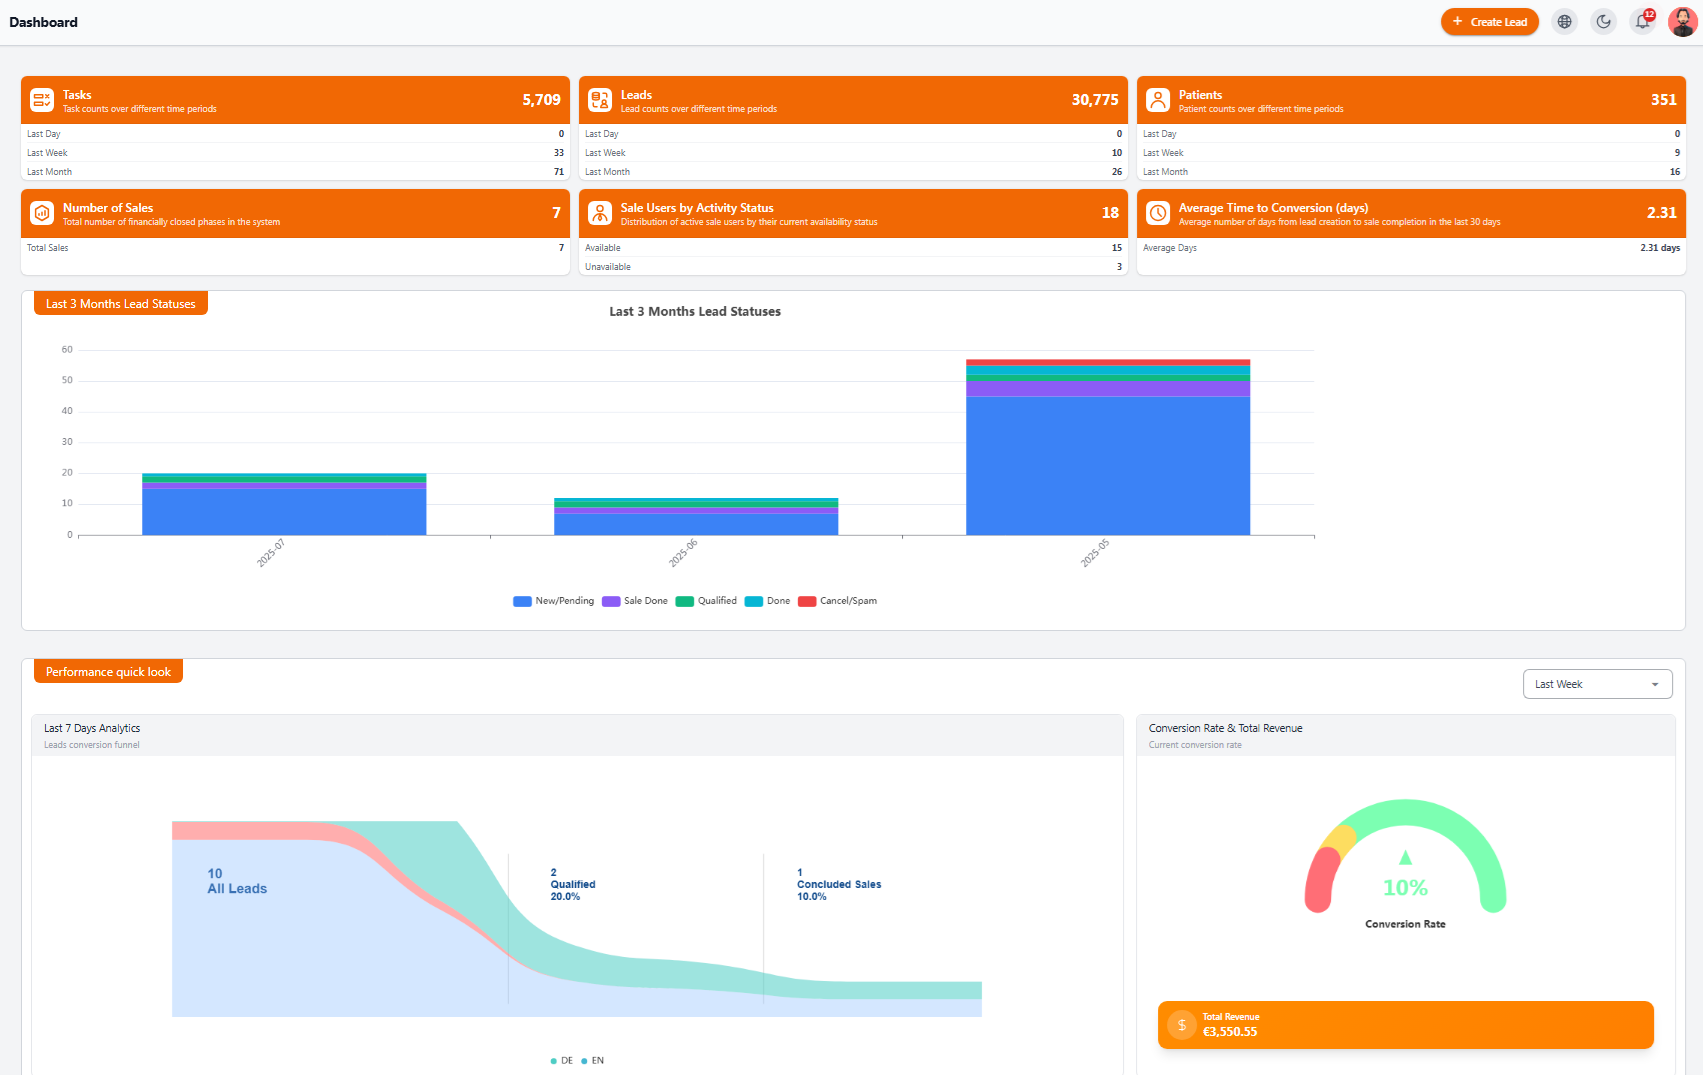
1️⃣ Statistical Boxes (Overall System Stats) #
At the top of the dashboard, there are 6 key statistical boxes:
| Title | Description |
|---|---|
| Tasks | Number of registered tasks in different periods (day, week, month) |
| Leads | Number of leads entered into the system across different timeframes |
| Patients | Number of patients registered daily, weekly, or monthly |
| Number of Sales | Total closed financial phases counted as final sales |
| Sale Users by Activity Status | Number of active and inactive sales users |
| Average Time to Conversion | Average time (in days) it took for leads to convert to sales |
A 3-month bar chart is displayed in the center of the page, showing lead status breakdown per month:
New/Pending
Sale Done
Qualified
Done
Cancel/Spam
3️⃣ System Performance Quick Look #
At the bottom of the page, you’ll see two important boxes:
🔻 Leads Conversion Funnel #
Shows how leads progressed over the past 7 days:
-
Number of leads entered
-
How many were Qualified
-
How many were Sold (finalized)
📈 Conversion Rate & Total Revenue #
-
Conversion rate from lead to sale (as %)
-
Total revenue (based on your system’s currency, e.g., Euro)
📝 Note: All data is live and auto-updated
Manager Dashboard #
The Manager Dashboard in NexaPortal provides a clear overview of recent leads, activities, and last 3 months’ statistics to the Sales Manager 📈. This page allows managers to view notifications, new leads, and performance charts without navigating away.
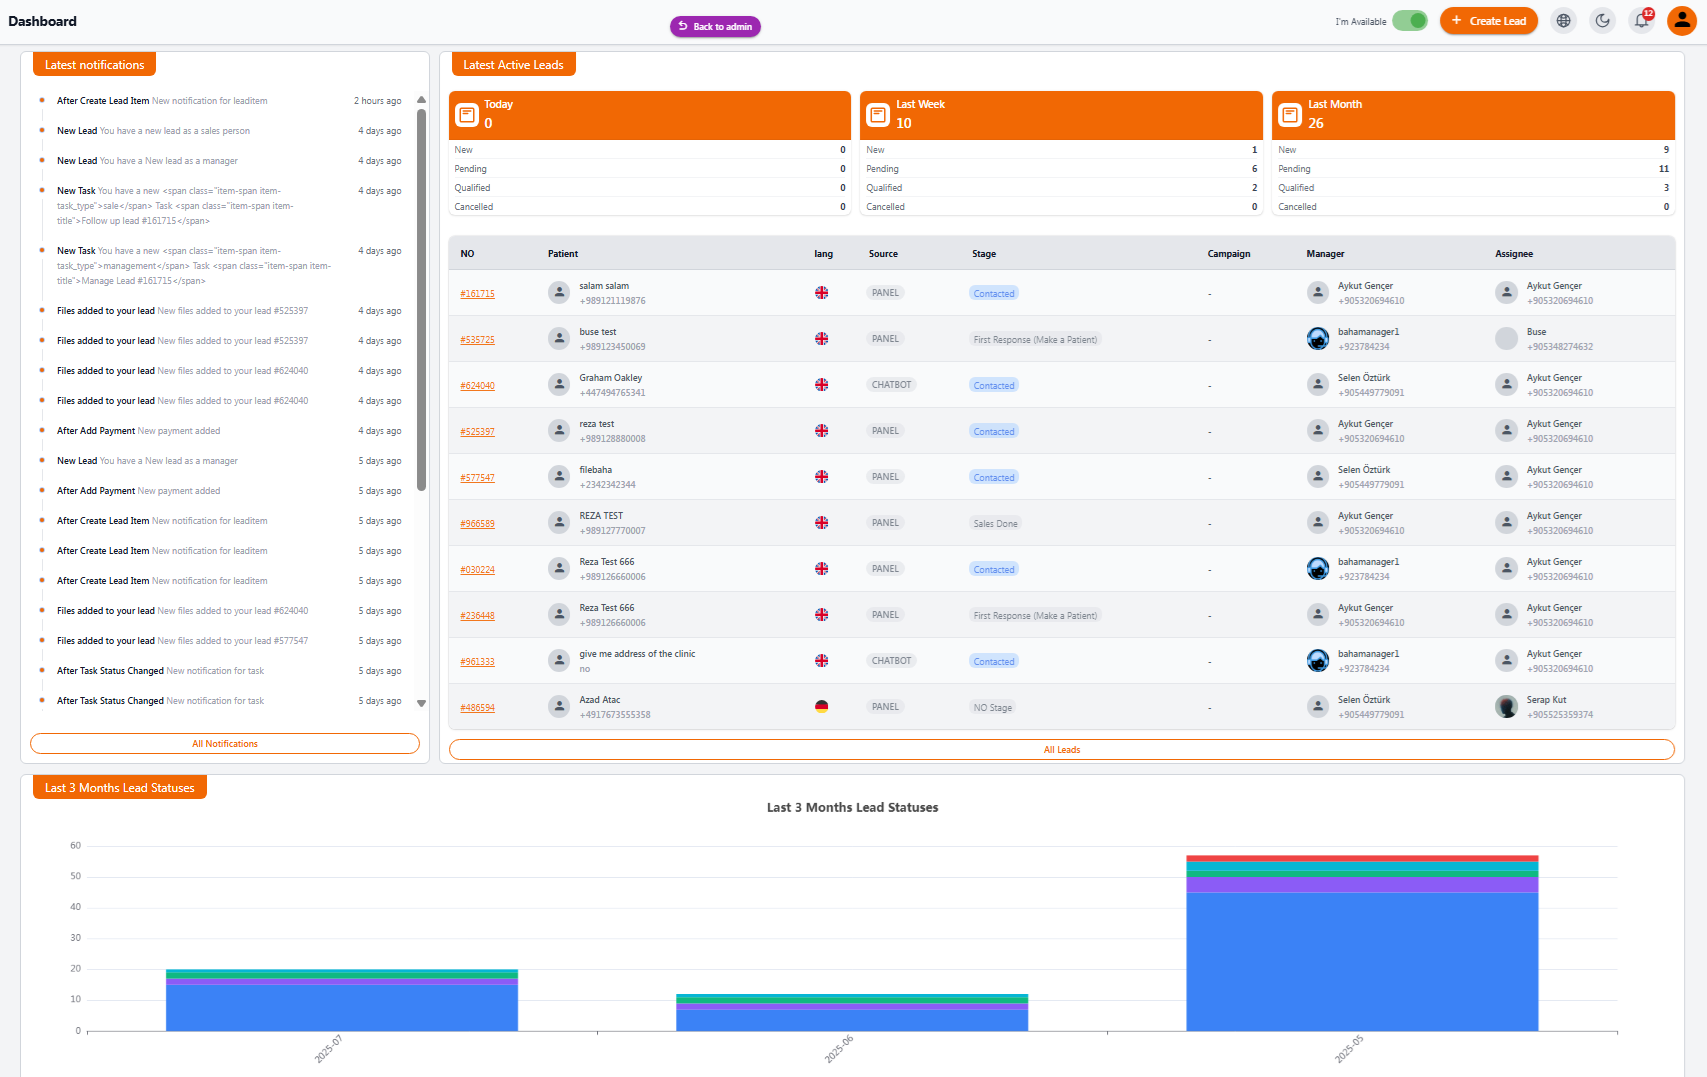
1️⃣ Latest Notifications #
On the left column, you can see a list of the most recent notifications, including key events:
• New lead created
• File added to a lead
• Task created or updated
• New payment registered
➡️ Click All Notifications to view the complete notifications page.
2️⃣ Latest Active Leads #
In the central section, you get a quick overview of active leads.
📊 Lead Stats #
Above the leads table, you’ll see stats for New, Pending, Qualified, and Cancelled leads in the timeframes: Today, Last Week, and Last Month.
🗂️ Leads Table #
The table includes the following info:
• Lead Number
• Message or Patient Name
• Lead Language
• Source (Panel or Chatbot)
• Current Stage
• Campaign (if any)
• Lead Manager
• Assignee
➡️ Click All Leads to view your full lead list.
3️⃣ Lead Status Chart (Last 3 Months) #
At the bottom of the page, a bar chart shows lead status breakdown for the last 3 months, categorized by month and stage:
New/Pending
Sale Done
Qualified
Done
Cancel/Spam
📝 Note: All data is automatically and live updated 🔄
Sales Dashboard #
The Sales Dashboard in NexaPortal is designed to help each Sales User quickly view the status of their assigned leads, recent notifications, and lead statistics from the past 3 months 📊. This dashboard is simple and focused, displaying only data related to the current sales user.
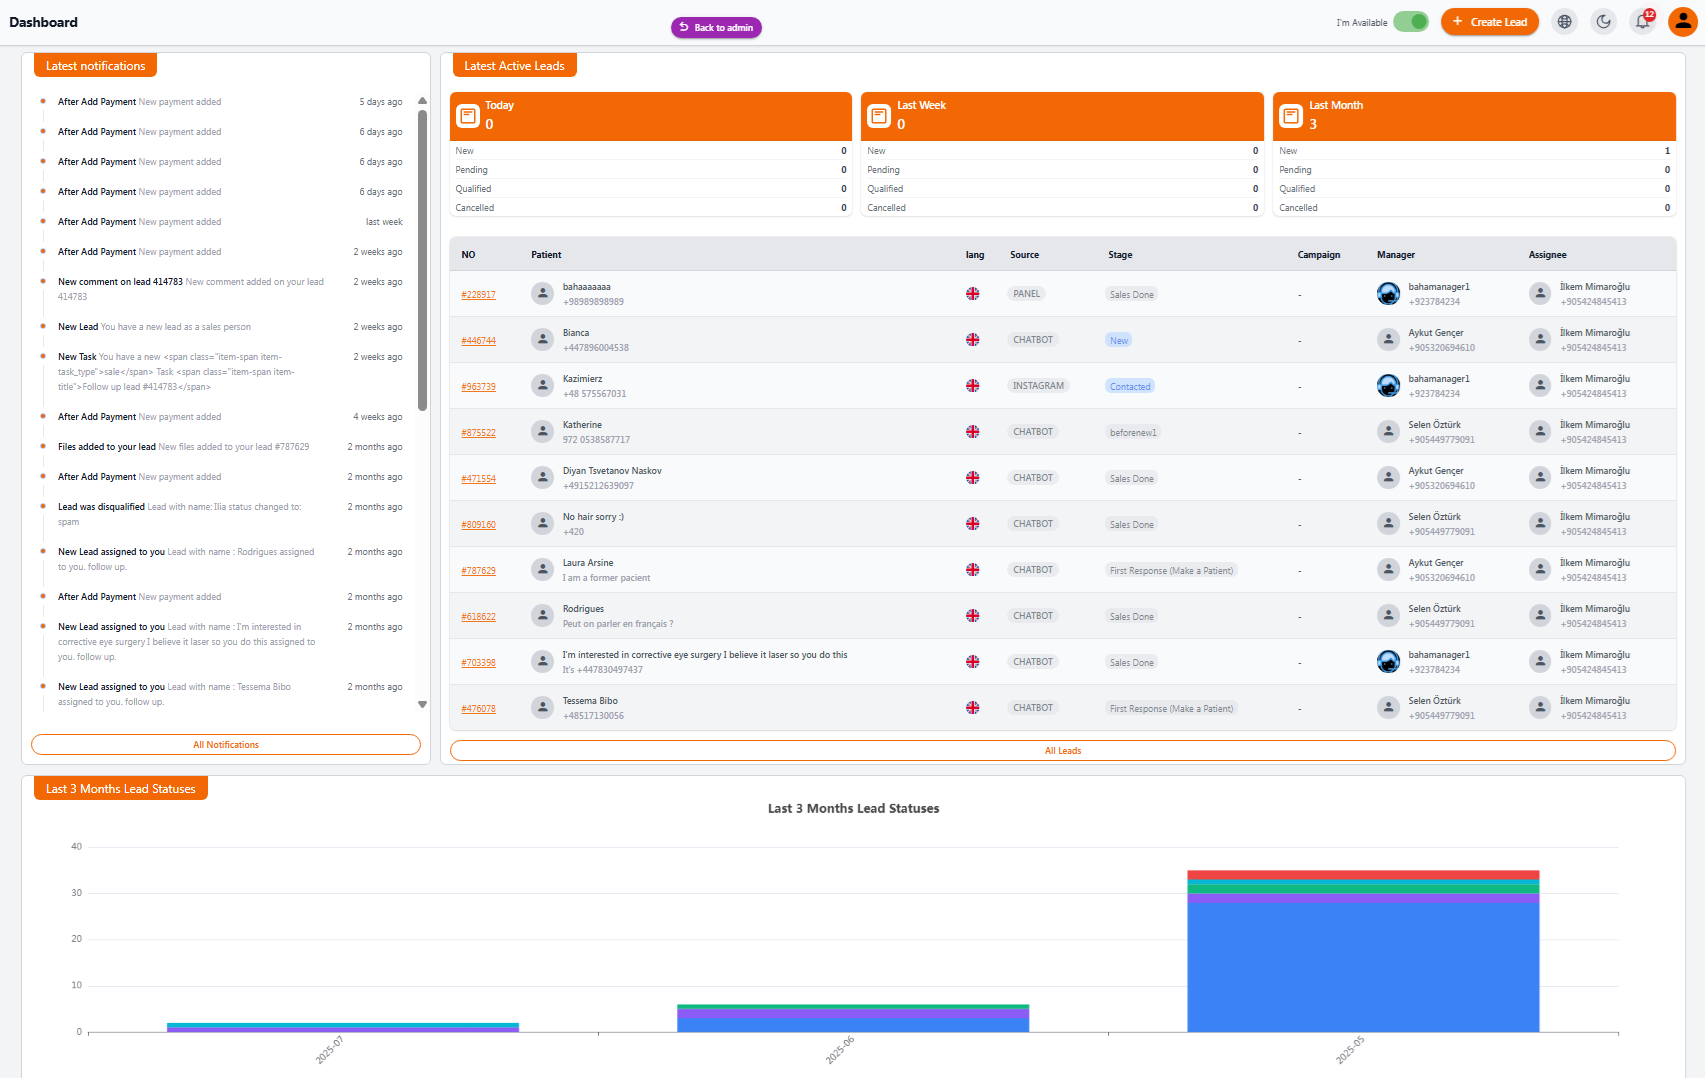
1️⃣ Latest Notifications #
On the left column, a list of the most recent notifications is shown, including:
• New payment added
• A new lead assigned to the sales user
• File or comment added to a lead
• Lead status changed
➡️ Click All Notifications to view the full list.
2️⃣ Latest Active Leads #
The center section of the dashboard shows a list of active leads assigned to the sales user.
📈 Lead Stats #
Above the table, you’ll find the number of leads created or assigned to this user over the past day, week, and month, categorized by status: New, Pending, Qualified, Cancelled.
🗂️ Leads Table #
The table includes:
• Lead Number
• Message or Patient Name
• Language
• Lead Source (Panel, Chatbot, Instagram, etc.)
• Current Stage
• Campaign (if any)
• Lead Manager
• Assigned Sales User (current user)
➡️ Use the All Leads button to view the complete list.
3️⃣ Last 3 Months Lead Status Chart #
At the bottom of the dashboard, a bar chart shows the status of this sales user’s leads over the past 3 months, color-coded by status:
New/Pending
Qualified
Sale Done
Cancel/Spam
📝 Note: The Sales Dashboard only displays leads assigned to the current user, keeping focus clear and relevant.
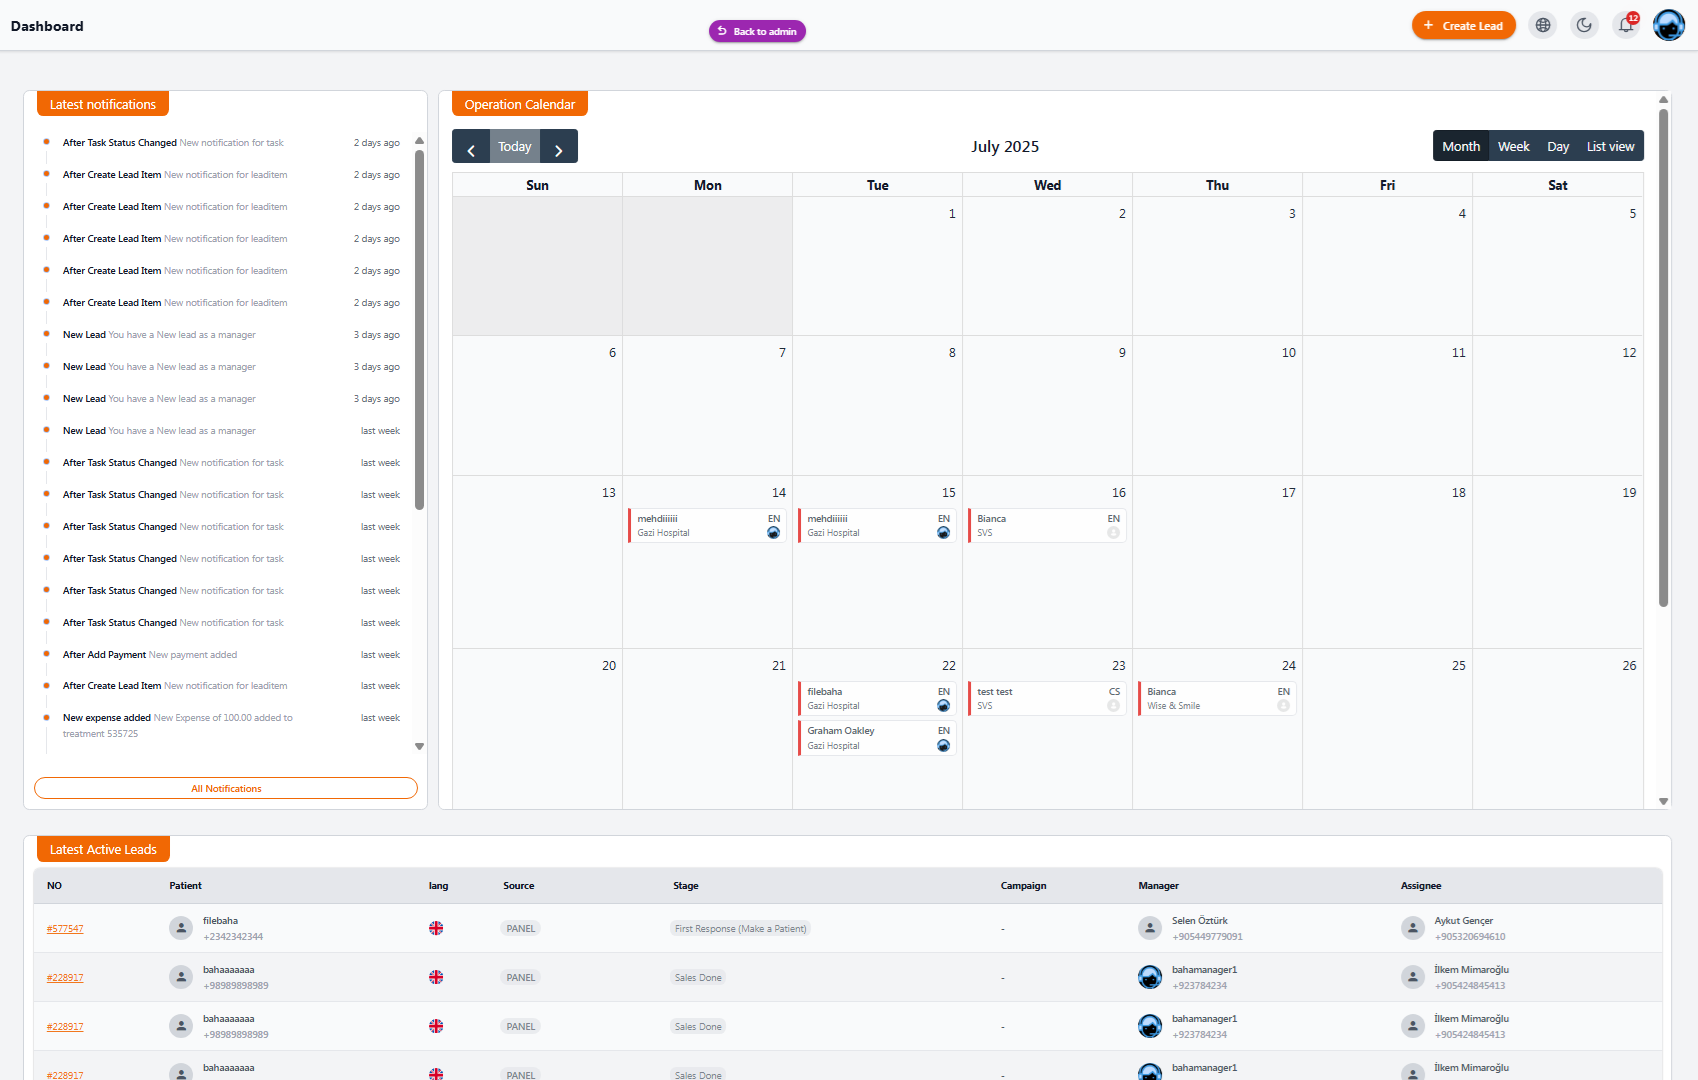
Field Operation Dashboard #
The Field Operation Dashboard in Nexa Portal is designed for operational users to get a quick view of their schedule, active leads, and important notifications at a glance. These users are usually responsible for on-site coordination such as transfers, receptions, or accompanying patients at medical centers.
1️⃣ Latest Notifications #
On the left column, you’ll see a list of the most recent notifications related to the user, including:
• New payment registered
• New task added or status changed
• Lead or task assigned to the user
➡️ Click All Notifications to view the full notification history.
2️⃣ Operation Calendar #
The core of this dashboard is the monthly calendar displayed in the center. It shows scheduled on-site operations, such as:
• Patient visit day to clinic or hospital
• Daily field tasks
• Required language for translation/services (e.g., EN, CS)
• Visit location (e.g., Gazi Hospital, SVS, Wise & Smile)
View modes include:
• Monthly (Month)
• Weekly (Week)
• Daily (Day)
• List View
3️⃣ Latest Active Leads #
At the bottom, a table of active leads assigned to this user is shown, including:
• Lead Number
• Patient Name or Initial Message
• Language
• Source (Panel, Chatbot)
• Current Stage
• Campaign (if any)
• Lead Manager
• Assigned User (this field operator)
📝 Note: This dashboard helps field users manage their work calendar visually and stay informed about their assigned leads in real time.
Transfer Dashboard #
The Transfer Dashboard in NexaPortal is tailored for users responsible for patient transportation, including airport transfers, clinic visits, and hotel shuttles. It offers a quick view of daily schedules, active leads, and related notifications.
1️⃣ Latest Notifications #
The left column includes notifications relevant to the transfer user, such as:
• A new lead assigned
• Task status changed related to transfer
• New payment registered or item added
➡️ Click All Notifications to access the full notification list.
2️⃣ Operation Calendar #
The main section of the dashboard is a monthly calendar showing daily transfer duties. Details shown in the calendar include:
• Patient Name or Lead Code
• Required Language (e.g., EN, CS)
• Destination or Medical Center (e.g., Gazi Hospital, SVS, Wise & Smile)
Calendar view modes available:
• Monthly (Month)
• Weekly (Week)
• Daily (Day)
• List View
3️⃣ Latest Active Leads #
At the bottom, a table of active leads assigned to this transfer user is displayed, including:
• Lead Number
• Patient Name or Message
• Language
• Source (e.g., Panel or Chatbot)
• Current Stage
• Lead Manager
• Assigned User (current transfer staff)
📝 Note: Transfer users only see leads assigned to them – ensuring they stay focused on their transport responsibilities.


